Animated Transitions in Statistical Data Graphics
Daniel Cornel, 0726194, 066 932
The program implements the basic idea proposed in Animated Transitions in Statistical Data Graphics (Heer and Robertson, 2007). Experiments have shown that transitions in charts such as filtering, sorting or value change operations are easier to follow if they are slowed down and animated. To increase the visual perception of the statistical data graphics with animation, design principles have been elaborated which mainly state that animation steps should produce valid, consistent and unambiguous output at all time and should be simple, predictable and comprehensible. Additionally, complex transitions should be split into different stages which are animated sequentially to keep the steps as simple as possible.
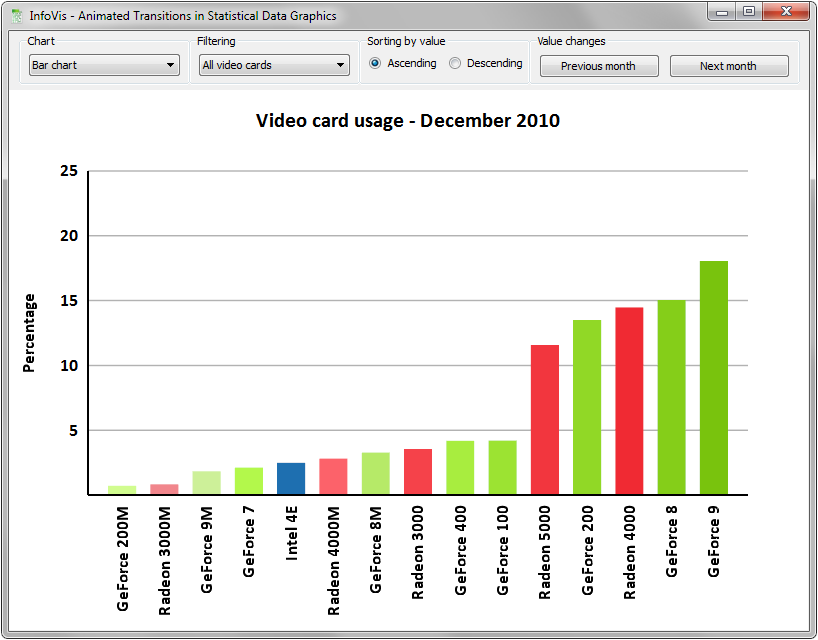
In this implementation, sorting, filtering and value change operations can be applied to bar charts, grouped bar charts, stacked bar charts and pie charts. It is furthermore possible to switch from one chart type to another. The underlying data was taken from the Steam Hardware & Software Survey from November 2010 to March 2011 and represents the usage of video card types for the services of the online gaming system Steam. The data has been processed such that elements of the same video card series were grouped. The 15 most common series were then chosen and normalized to 100%.
implementation
The program is realized in C++ using Qt4 for the user interface. The charts are displayed with the help of OpenGL using GLEW32 as well as the QPainter of Qt4. Furthermore, the OpenGL Mathematics library GLM is used.
The main idea of the implementation is to use a centralized Transition Manager which receives and processes all transition requests. Transitions are subdivided into Atomic Transitions such as move, scale and rotate and the complex Compound Transitions such as filtering and sorting operations.
alterable objects
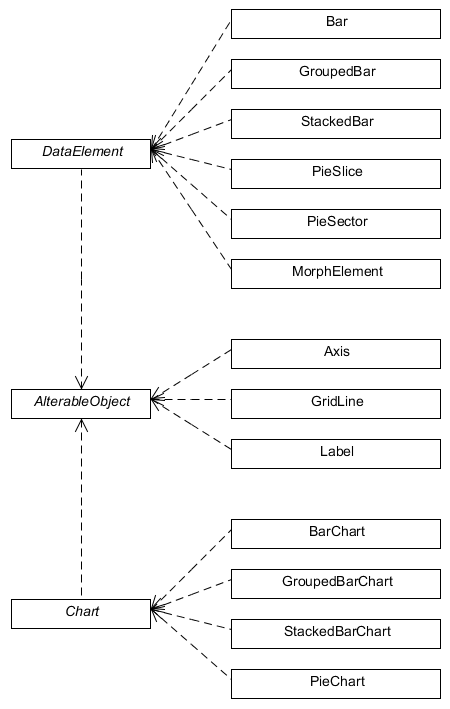
Transitions can modify every visible element of the chart, including the chart itself. Therefore, all visible elements inherit from Alterable Object to provide an interface for the transitions. Furthermore, elements representing data values inherit from Data Element and charts inherit from Chart. It is to mention that some transitions only work with some alterable objects, e.g. the Rotate Transition only works with Pie Slices of a Pie Chart and Morph Transitions can only morph Morph Elements to the shape of a Bar or a Pie Slice.
transitions
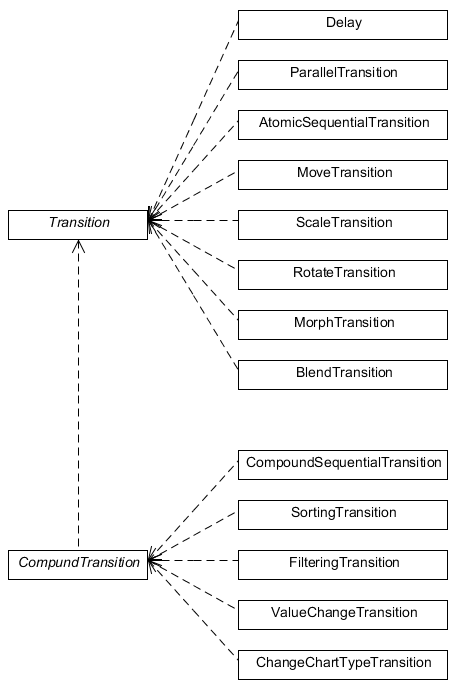
The program offers a Sorting Transition, a Filtering Transition, a Value Change Transition and a Change Chart Type Transition to manipulate the chart. These complex transitions are called Compound Transitions and are composed of Atomic Transitions. The atomic transitions Move Transition, Scale Transition, Rotate Transition, Blend Transition and Morph Transition each apply simple modifications to alterable objects. The Parallel Transition and Atomic and Compound Sequential Transition make it possible to create sequential orders of transitions and therefore animations which can be timed using a Delay object.
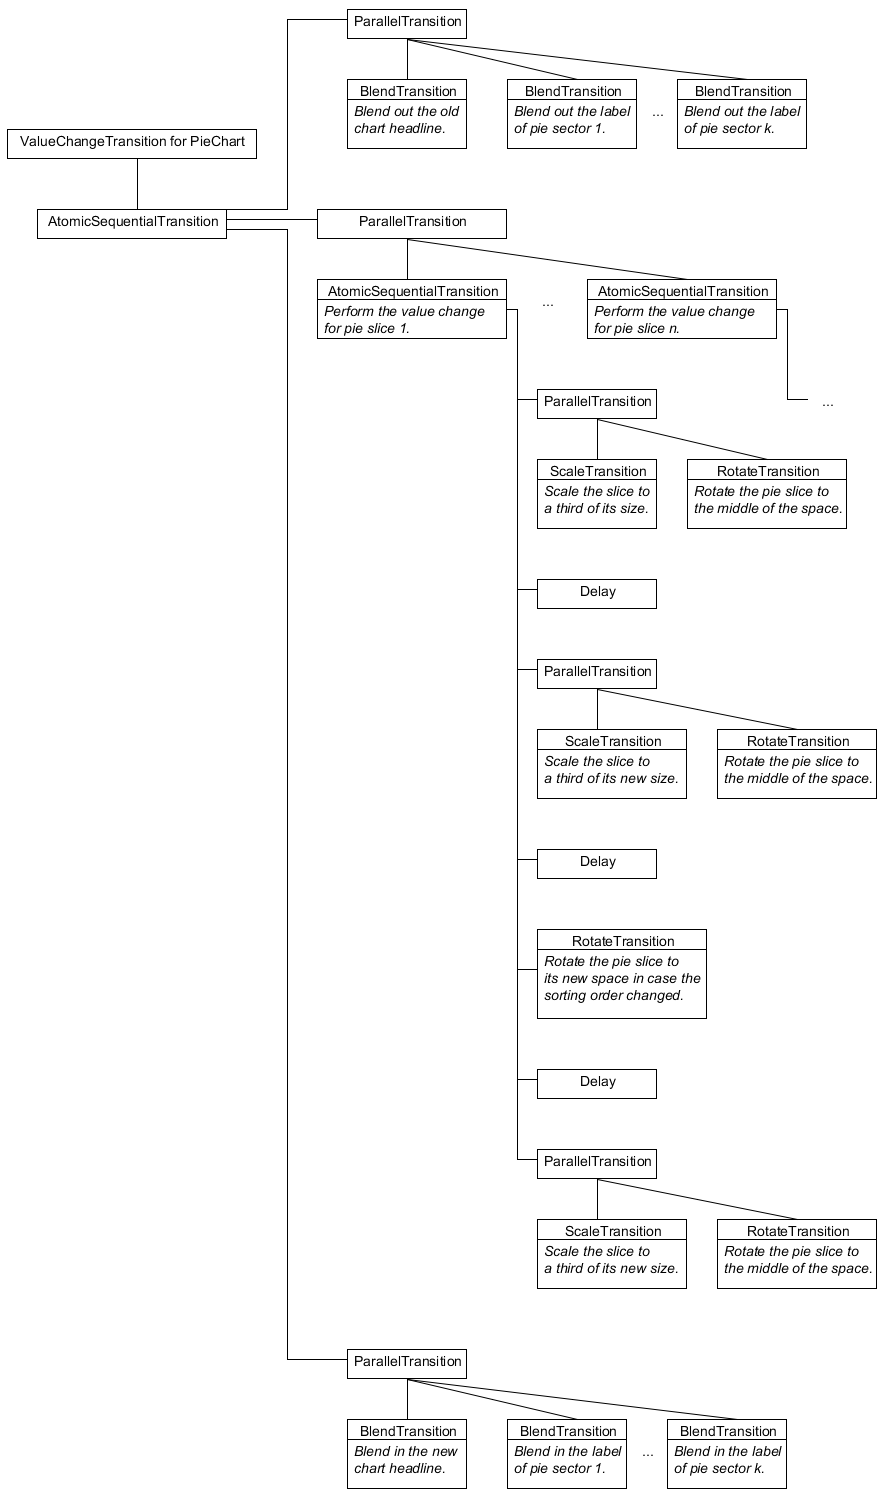
The Compound Transitions are created by the Transition Manager as hardcoded complex sequences of Atomic Transitions. The graph below demonstrates the compound of the mid-length Value Change Transition in a pie chart. Note that the Parallel Transitions were simplified if they include similar transitions for several elements of the chart.
download
Download the binaries for Windows (~4.29 MB).
Download the source code + binaries for Windows (~9.71 MB). Besides the Visual Studio 2008 project, the GLEW and GLM libraries as well as the used Qt4 headers and libraries are included. The generated documentation for the code can be found here.