Information
- Visibility: hidden
- Publication Type: Journal Paper with Conference Talk
- Workgroup(s)/Project(s):
- Date: October 2008
- Journal: IEEE Transactions on Visualization and Computer Graphics
- Volume: 14
- Number: 6
- Location: Columbus, Ohio, USA
- Lecturer: Johannes Kehrer
- Event: IEEE Visualization 2008
- Pages: 1579 – 1586
Abstract
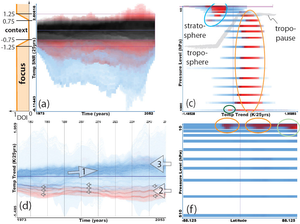
One of the most prominent topics in climate research is the investigation, detection, and allocation of climate change. In this paper, we aim at identifying regions in the atmosphere (e.g., certain height layers) which can act as sensitive and robust indicators for climate change. We demonstrate how interactive visual data exploration of large amounts of multi-variate and time-dependent climate data enables the steered generation of promising hypotheses for subsequent statistical evaluation. The use of new visualization and interaction technology -- in the context of a coordinated multiple views framework -- allows not only to identify these promising hypotheses, but also to efficiently narrow down parameters that are required in the process of computational data analysis. Two datasets, namely an ECHAM5 climate model run and the ERA-40 reanalysis incorporating observational data, are investigated. Higher-order information such as linear trends or signal-to-noise ratio is derived and interactively explored in order to detect and explore those regions which react most sensitively to climate change. As one conclusion from this study, we identify an excellent potential for usefully generalizing our approach to other, similar application cases, as well.Additional Files and Images
Weblinks
BibTeX
@article{Kehrer-2008-hyp,
  title =      "Hypothesis Generation in Climate Research with Interactive
               Visual Data Exploration",
  author =     "Johannes Kehrer and Florian Ladst\"{a}dter and Philipp Muigg
               and Helmut Doleisch and Andrea K. Steiner and Helwig Hauser",
  year =       "2008",
  abstract =   "One of the most prominent topics in climate research is the
               investigation, detection, and allocation of climate change.
               In this paper, we aim at identifying regions in the
               atmosphere (e.g., certain height layers) which can act as
               sensitive and robust indicators for climate change. We
               demonstrate how interactive visual data exploration of large
               amounts of multi-variate and time-dependent climate data
               enables the steered generation of promising hypotheses for
               subsequent statistical evaluation. The use of new
               visualization and interaction technology -- in the context
               of a coordinated multiple views framework -- allows not only
               to identify these promising hypotheses, but also to
               efficiently narrow down parameters that are required in the
               process of computational data analysis. Two datasets, namely
               an ECHAM5 climate model run and the ERA-40 reanalysis
               incorporating observational data, are investigated.
               Higher-order information such as linear trends or
               signal-to-noise ratio is derived and interactively explored
               in order to detect and explore those regions which react
               most sensitively to climate change. As one conclusion from
               this study, we identify an excellent potential for usefully
               generalizing our approach to other, similar application
               cases, as well.",
  month =      oct,
  journal =    "IEEE Transactions on Visualization and Computer Graphics",
  volume =     "14",
  number =     "6",
  pages =      "1579--1586",
  URL =        "https://www.cg.tuwien.ac.at/research/publications/2008/Kehrer-2008-hyp/",
}


 Draft
Draft Slides

