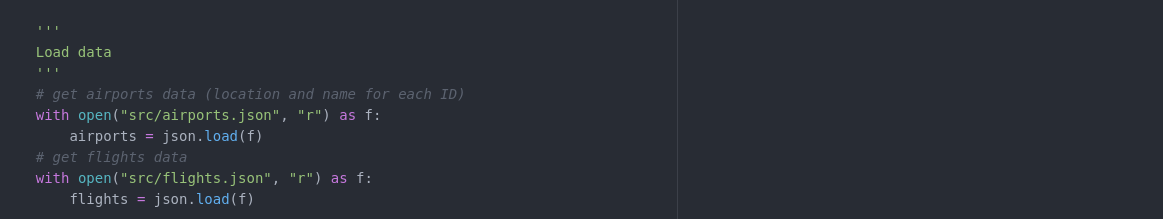
The edge-bundling starts by loading already processed data (simple data processing without any special details). For the given data set(s), airports.json contains information about airports such as their name and location. flights.json contains information about connections between airports based on flights that happened between them.The process is the same for the other data.
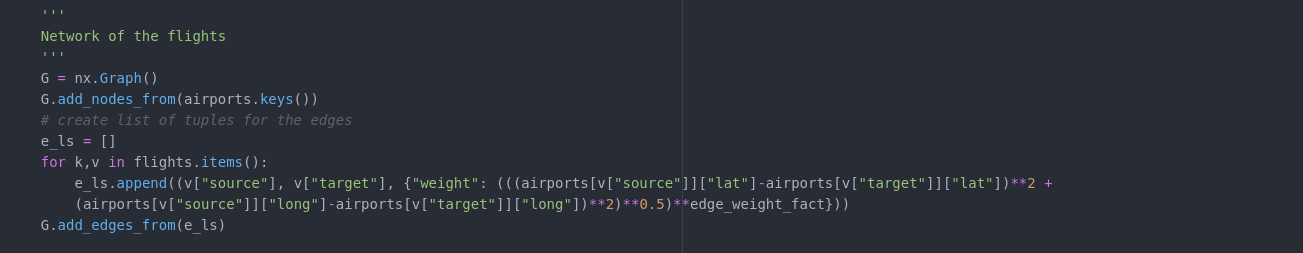
Next, a network graph is created from the previous data. The distance of the airports is given as the weight of the edges - scaled by a variable exponent.
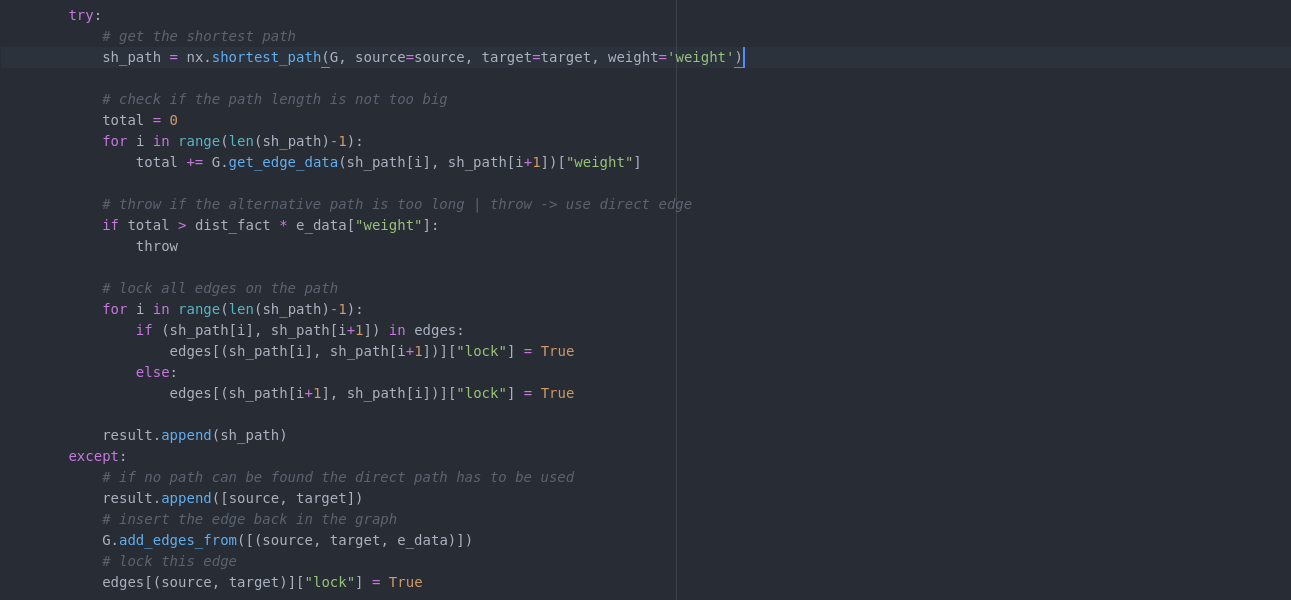
The edges are retrieved again and sorted in order to start bundling the longest edges.

After that one iterates over the sorted list of edges and tries to bundle them - this can fail if the edge is locked (already in a path bundle), no alternative path exists or the alternative path is too long.
Skip locked edges

Bundle if path exist and is short enough (also lock edges on path) or skip.
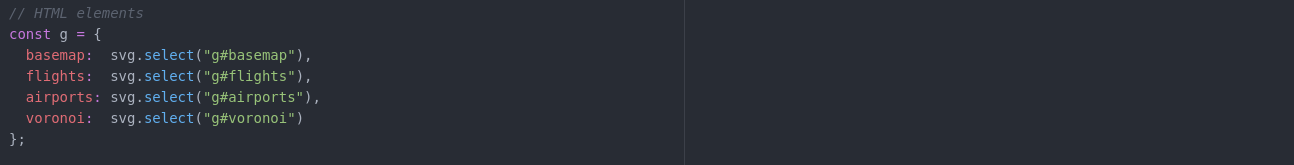
The visualisation is done via d3.js - especially the map and network visualisation is motivated by Sophie Engle and some copyright goes to her. For this an html page with some svg elements was needed. Those could then be grabbed in the Javascript file in order to add elements for the visualisation.
The data was provided online and is loaded and called to be processed.
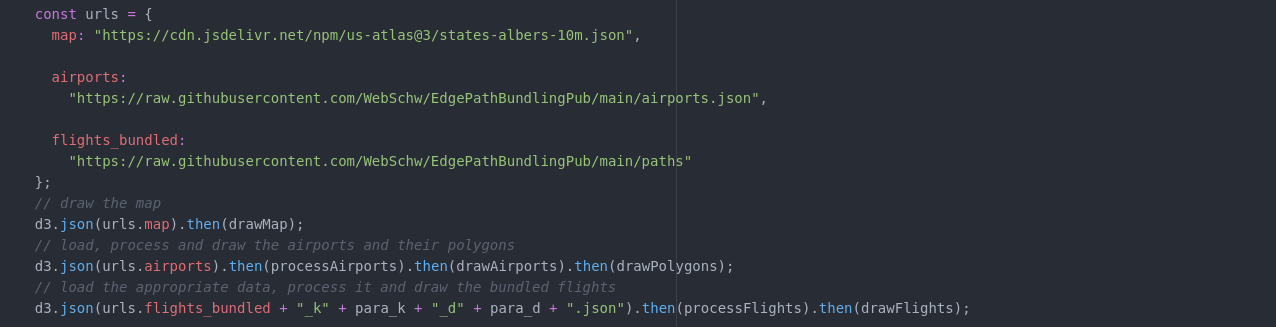
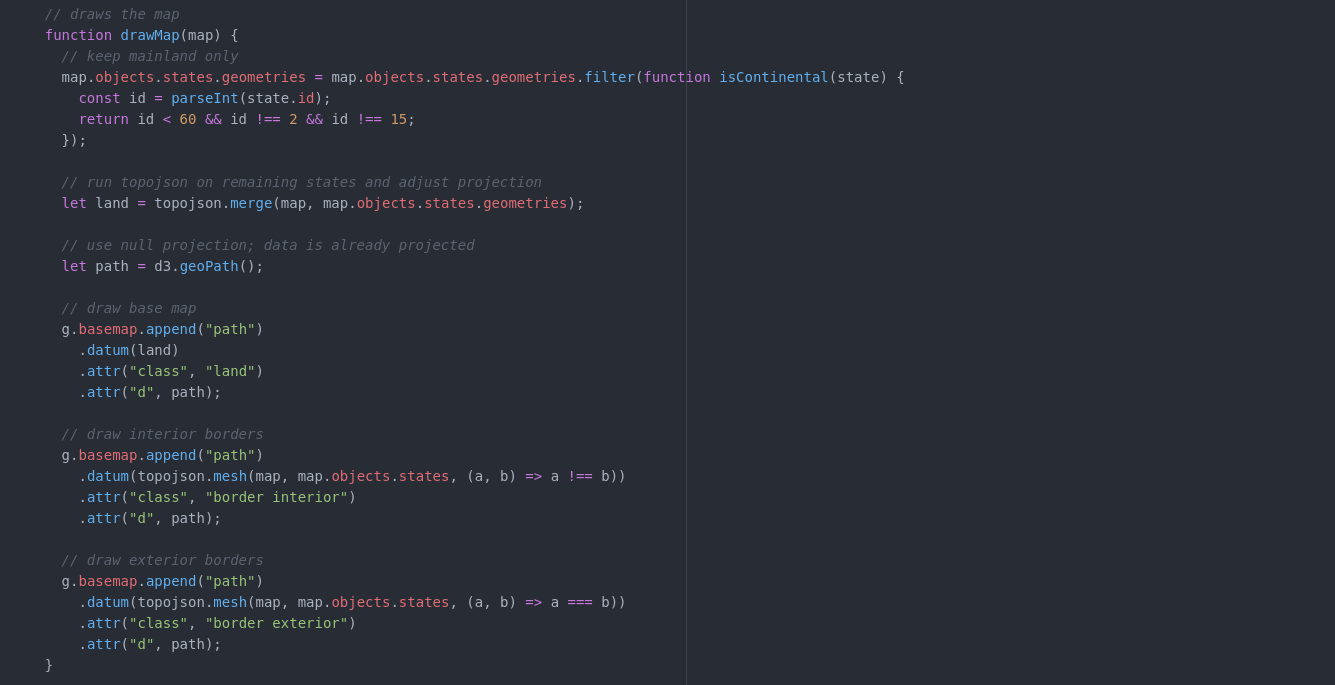
The map is drawn using the loaded geoJSON.
Airports are drawn as circles.

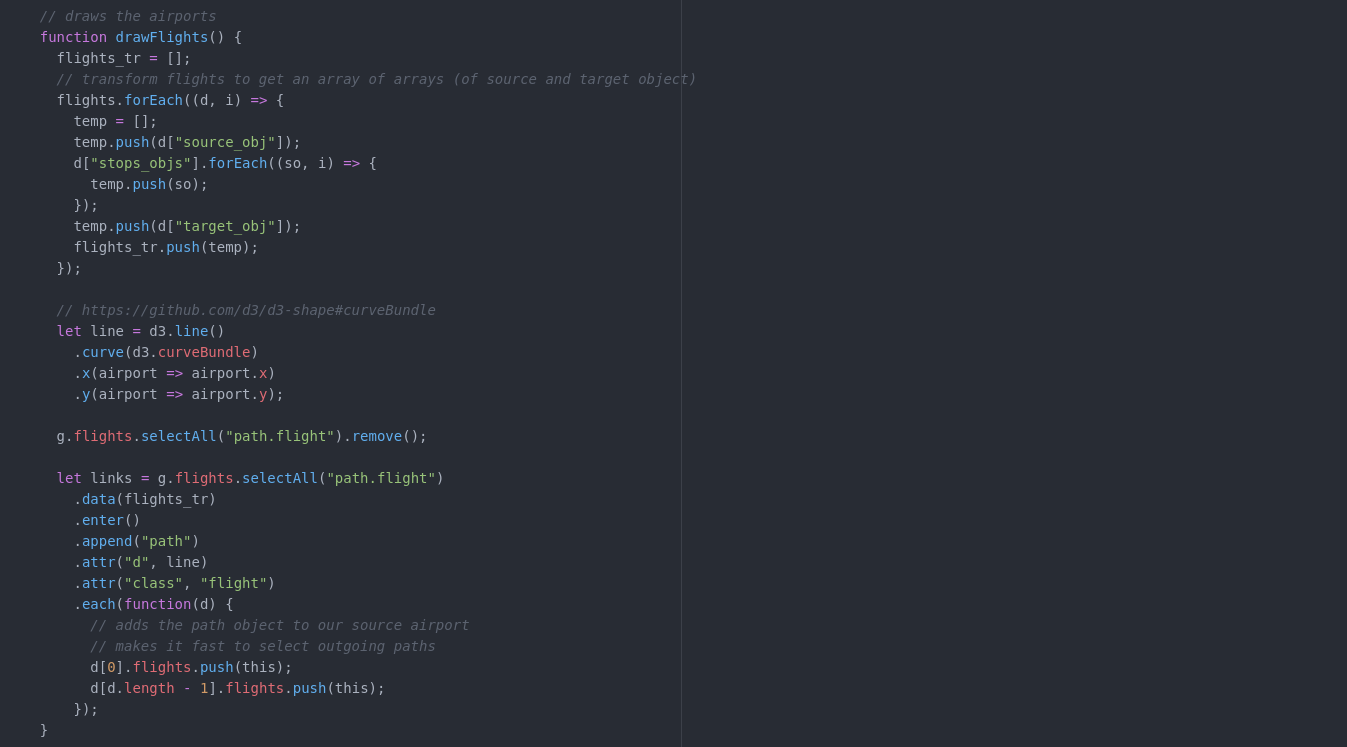
Flights are implemented as paths. The paths are originally hopping over the intermediate airports but curveBundles are used to smoothen them out. The path segments are added to the two airports at the beginning and ending of this path so they are easily accessible for highlighting.
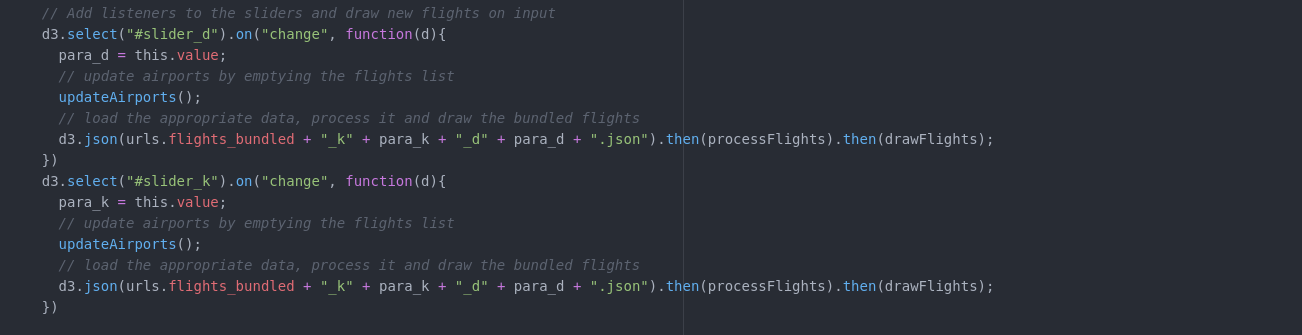
Listeners are introduced to react to the changes on the sliders -> upon change data is loaded dynamically and the flight paths are renewed. The airports need to be updated in order to have the new list of connected paths.
The highlighting of the airports is done with the help of Voronoi polygons that splits the complete graph into areas according to the closest airport. Knowing this one can access the airport data and highlight the according edges.