This project was developed for the Visualization 2 (186.833) course at TU Wien during the Winter 2024 semester.
The project implements Linde-Buzo-Gray algorithm for stippling of 2D Scalar fields, based on the research paper Stippling of 2D Scalar Fields by Görtler et al.
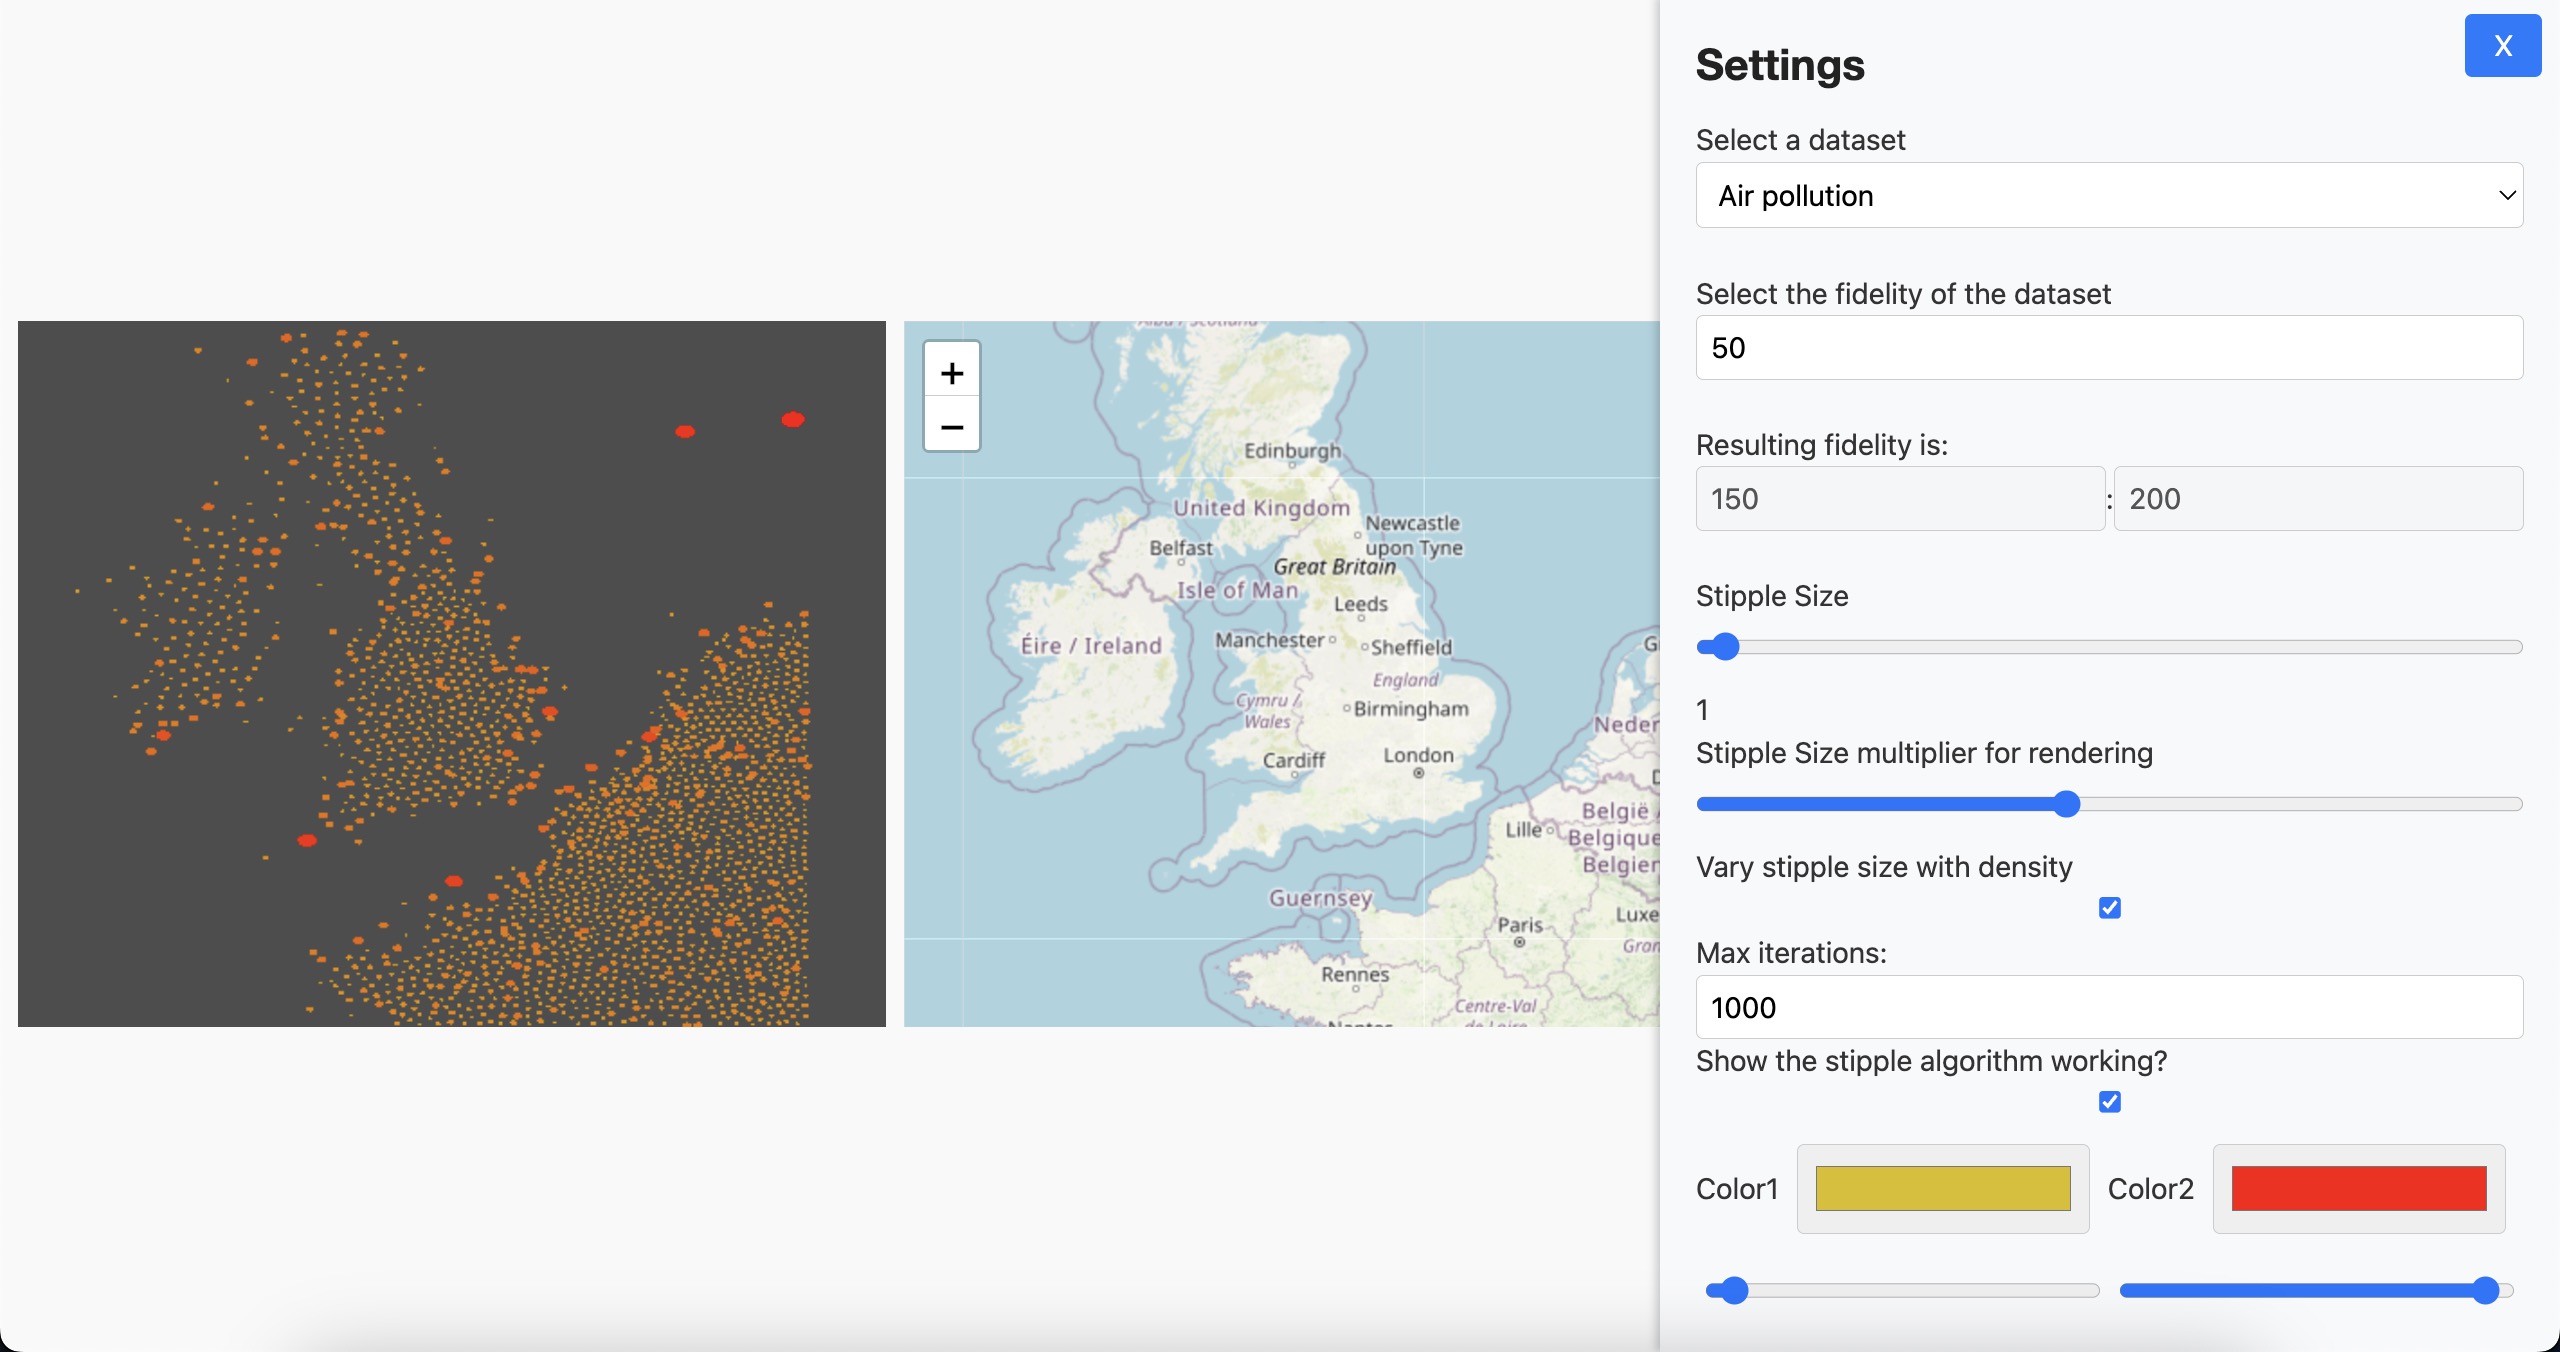
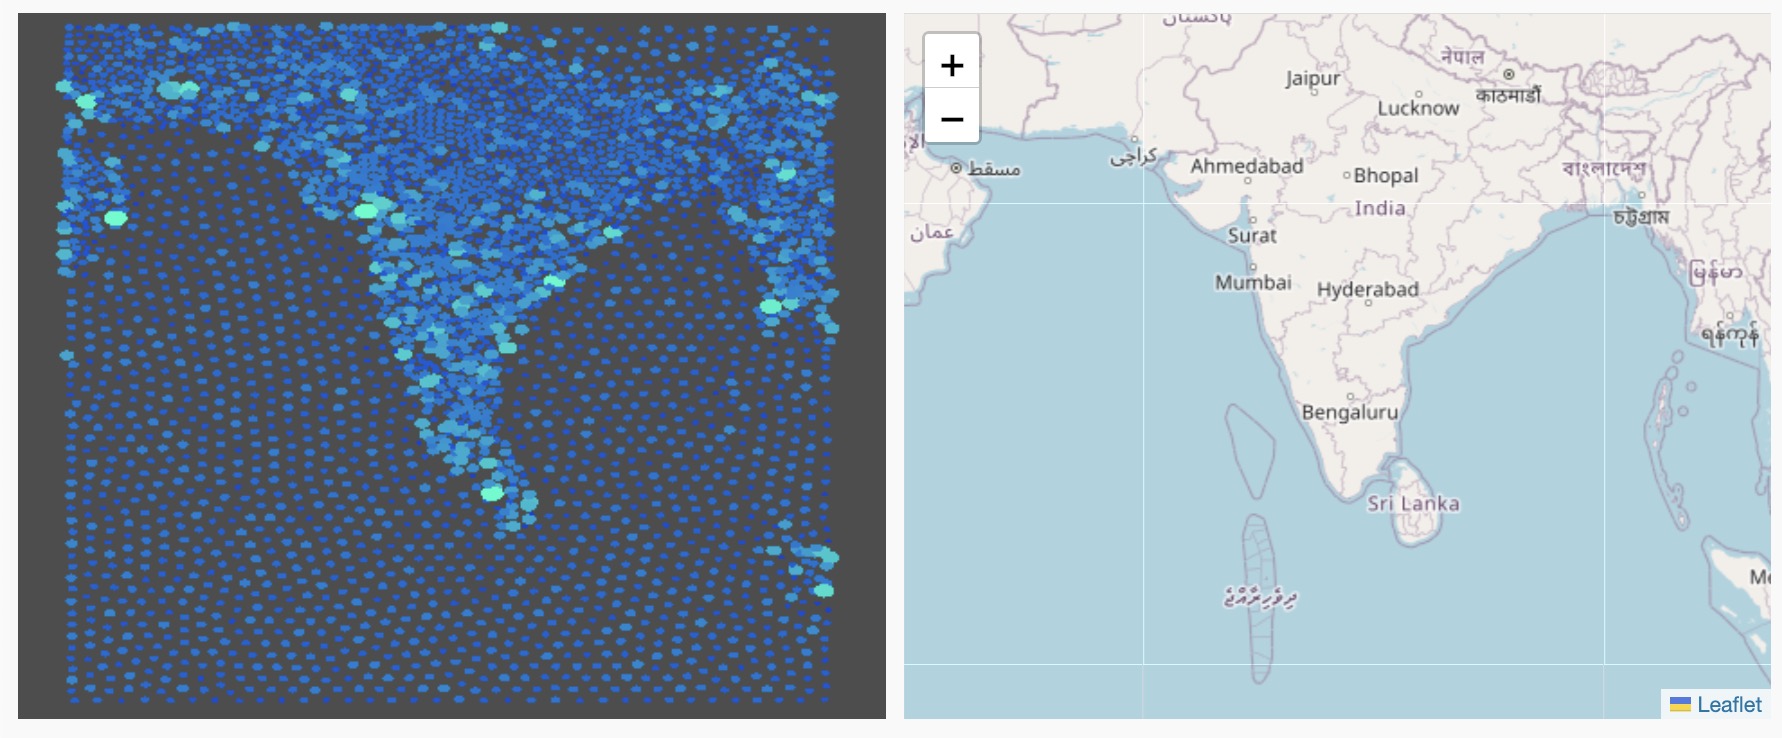
Our data pipeline began with GeoTIFF (.tif) files which are a standard format for storing georeferenced raster images. We used GDAL (Geospatial Data Abstraction Library) a powerful translator library by the Open Source Geospatial Foundation to process these files. The workflow involved converting large GeoTIFF files into manageable tiles which we then transformed into SQL using raster2pgsql. These SQL files are then used to populate our PostGIS(PostgreSQL) database. The data is then returned by our backend which returns the stipples in a uniformly spaced grid, generated from normally distributed sample points within the bounded geographic frame.
At the core of our visualization is the Linde-Buzo-Gray (LBG) algorithm implementation. The algorithm starts with a set of points in a uniformly spaced grid. These points undergo an iterative refinement process where each point is moved to the centroid of its Voronoi region, weighted by the underlying density function (our geographic data). This process continues until convergence or a maximum number of iterations is reached, resulting in a distribution of points that effectively represents the density of the underlying data.
For rendering we used WebGPU, a modern graphics API that provides high-performance 3D graphics and computation capabilities. Our implementation uses compute shaders for efficient point processing and rendering pipelines for smooth visualization. The WebGPU implementation allows us to handle thousands of stipple points in real-time, with dynamic updates as users adjust parameters or pan across the map. We've implemented features such as variable stipple sizes based on density, color mapping and interactive controls for adjusting the visualization parameters.
The application provides a set of controls through its settings panel, allowing users to fine-tune various aspects of the visualization:
The complete source code documentation can be found at https://dominikkanjuh.github.io/TUW-Visualization-2/frontend/index.html.
The source code repository is available on GitHub at https://github.com/DominikKanjuh/TUW-Visualization-2.
database/: Contains the SQL files and initialization script
backend/: Contains the backend code (Node.js and
Express.js)
frontend/: Contains the frontend code (TypeScript and
WebGPU)
Each of the backend and frontend code has its own README file with instructions on how to run the code separately on your local machine.
Note: Since the SQL files to populate the database were too large for
GitHub, they've been stored on OneDrive. To download them, you can run the
script /database/download-sql.sh
For the simplest way to run the entire project (after downloading the sql
files) you can use Docker Compose:
docker compose up --build
We would like to acknowledge the following sources for providing the datasets used in this project: