Overview
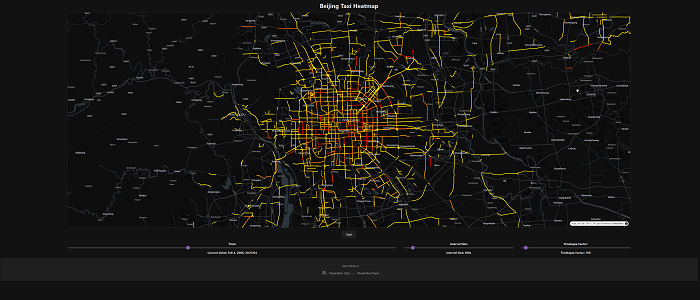
The Beijing Taxi Heatmap Visualization is a realtime tool designed to display the movement and density of taxis across Beijing depending on the time of day. You can select a time interval for the taxi data points that are to be displayed. We used deck.gl with MapLibre for rendering, FastAPI for the backend, and GeoPandas for spatial data processing.
Features
- Time slider to select a point in time as the center of the interval.
- Start and Stop buttons to automatically traverse the timeline.
- Sliders for interval size and traversal speed.
- Color gradient to display the density of taxis for each street.
- Interactive map control (zoom, movement).
How It Works
The application fetches taxi location data from the backend server, matches it to Beijing's street network to determine taxi densities across different street segments, and then visualizes this data on an interactive map. Users can control the time intervals and playback speed to display taxi density over specific periods.
Program
View Live ProgramSource Code
View Source CodeCode Documentation
View Source CodeInstallation
Follow the steps below to set up the project locally:
- Execute download_data.sh in src/backend to download the dataset
- Use environment.yml in src/backend to activate the conda environment with the necessary dependencies
- Open a powershell window in src/backend and type:
fastapi dev main.py - The first startup will take a bit longer, because the street network of Beijing will be downloaded and cached
- Once the application is running, execute the index.html (via the link above) to open the frontend application
Technologies Used
- Frontend: HTML, CSS, JavaScript, deck.gl, MapLibre GL
- Backend: FastAPI, GeoPandas, Pandas, BallTree from scikit-learn
- Data Visualization: GeoJSON, Heatmap Layers
- Version Control: GitHub
Authors
- Maximilian Payer
- Maximilian Zirps