1. Getting Started
1.1 Prerequisites
- Node.js: Make sure you have Node.js installed on your machine.
- npm: npm comes bundled with Node.js.
1.2 Installation
- Download the Project: Download the project files from the provided folder.
- Navigate to the Project Directory: Open your terminal and change your directory to the extracted project folder.
- Install the necessary packages using npm:
npm install - Running the Application:
npm run dev - Navigate to the Localhost Location
NOTE: The application was primarily developed and tested using Safari on a Mac M1.
2. Functions and Goals of the Visualization
2.1 Objective and Functions
Traditional maps often struggle to effectively represent temporal dimensions, making it challenging to analyze changes over time. The authors of the Flowstrates paper (Flowstrates: An approach to visually exploring temporal origin and destination data” by Ilya Boyandin, Enrico Bertini, Peter Bak, and Denis Lalanne) addressed this issue by creating an interactive visualization that combines two maps with a central heatmap, allowing users to explore temporal origin and destination data seamlessly.
My objective was to implement this foundational idea primarily using Three.js, while integrating additional functionalities to enhance interactivity and scalability. Additionally, I focused on making the visualization suitable for large datasets by incorporating real-time visualization strategies to maintain performance and responsiveness.
2.2 General Functions
- Maps for Origin and Destination: Two maps display the origin (left) and destination (right) countries.
- Heatmap Calculation:
- Clicking on a country in either map generates a heatmap visualizing all possible relationships (1-to-n / n-to-1) with other countries.
- Clicking a second country visualizes the 1-to-1 relationship in the heatmap.
- Hover Interactions:
- Hovering over years highlights the trend on the n-side (destination or origin) across the years, with corresponding color changes on the map.
- Hovering over heatmap cells displays a tooltip with details, including the value.
- Reset Options: Clears the selection of the origin country, destination country, or both.
2.3 Added Functions
- Zoom Functionality: Enables zooming and interactivity with the world map.
- Filter Functionality:
- Two filter attributes are available, dynamically showing only relevant options based on the selected country.
- Using the "Complete Reset" button also resets all applied filters.
- Dataset Selection: Supports dataset integration with a simple pre-processing workflow (details to be provided later).
2.4 Real-Time Challenges and Solutions
Problem 1: Slow Heatmap Rendering for Large Datasets
- Challenge: For datasets with millions of rows, the heatmap becomes slow to load when selecting a country. The root cause is that for every selected country, the system needs to aggregate the raw data for all other countries before rendering the heatmap.
- Solution: A progressive rendering strategy is used to improve performance:
- The heatmap first loads a tiny resolution subset of the data (2% of the rows) for an immediate visual preview.
- Next, it loads a low-resolution subset (e.g., 10% of the rows) to improve accuracy.
- Finally, the complete dataset (high resolution) is loaded and rendered in chunks to ensure smooth interactions without freezing the application.
Problem 2: Slow Interactivity with World Maps
- Challenge: Interaction with the two world maps (origin and destination) becomes slow as the number of polygons (countries and their sub-regions) increases. For example, hovering or clicking on countries with complex geometries causes delays in detecting interactions.
- Solution:
- A quadtree-based spatial indexing is implemented for both maps. The strategy involves:
- Dividing the map into hierarchical regions, enabling fast lookups for mouse interactions (clicks and hovers).
- Each country is represented as a collection of polygons, with their centers and bounding boxes indexed in the quadtree.
- When the user interacts with the map, the quadtree quickly determines which country or polygon is affected, significantly reducing computational overhead.
- A quadtree-based spatial indexing is implemented for both maps. The strategy involves:
2.5 Data
2.5.1 Current Datasets
- International Trade (~5.7M rows):
- Columns:
origin,destination,year,value,ATTR_1(transaction type),ATTR_2(goods classification). - Years: 1990–2021.
- Filters: Export categories (ATTR_1), Goods categories (ATTR_2).
- Columns:
- Refugee Flow (~100k rows):
- Columns:
origin,destination,year,value. - No filter attributes.
- Columns:
2.5.2 Adding a New Dataset
- Requirements:
- CSV format with
origin,destination,year,valuecolumns. Optional:ATTR_1,ATTR_2for filters.
- CSV format with
- Steps:
- Place the CSV in
src/data/. - Update the dropdown in
filter-attr.js:datasetSelect.append('option') .attr('value', 'src/data/new-dataset.csv') .text('name_of_the_dataset');
- Place the CSV in
3. Code Documentation
3.1 General Overview
File Structure and Descriptions
- index.html: Main entry point of the application.
- src/styles/style.css: Contains styles for the application.
- src/js/filter-attr.js: Handles dataset selection and filter dropdowns.
- src/js/left-map.js: Renders the origin map using
Three.js. - src/js/right-map.js: Similar to
left-map.js, but for the destination map. - src/js/map-interaction.js: Loads country geometries and adds them to the
Three.jsscene. - src/js/map-quadtree.js: Implements a quadtree for efficient spatial queries on the maps.
- src/js/heatmap.js: Manages the rendering and interaction of the central heatmap.
- src/js/updateHeatmap.js: Defines the logic for filtering, aggregating, and progressively rendering heatmap data.
- src/js/tooltipHelpers.js: Provides reusable functions for creating and updating tooltips.
- src/data/: Contains datasets in CSV format.
Key Dependencies and Relationships
- D3.js: Used across the application for CSV parsing and DOM manipulation.
- Three.js: Renders the origin and destination maps.
- Quadtree: Shared by both maps for spatial indexing.
- Filter Logic: Dynamically updates dropdowns based on datasets and applies filters on the heatmap data.
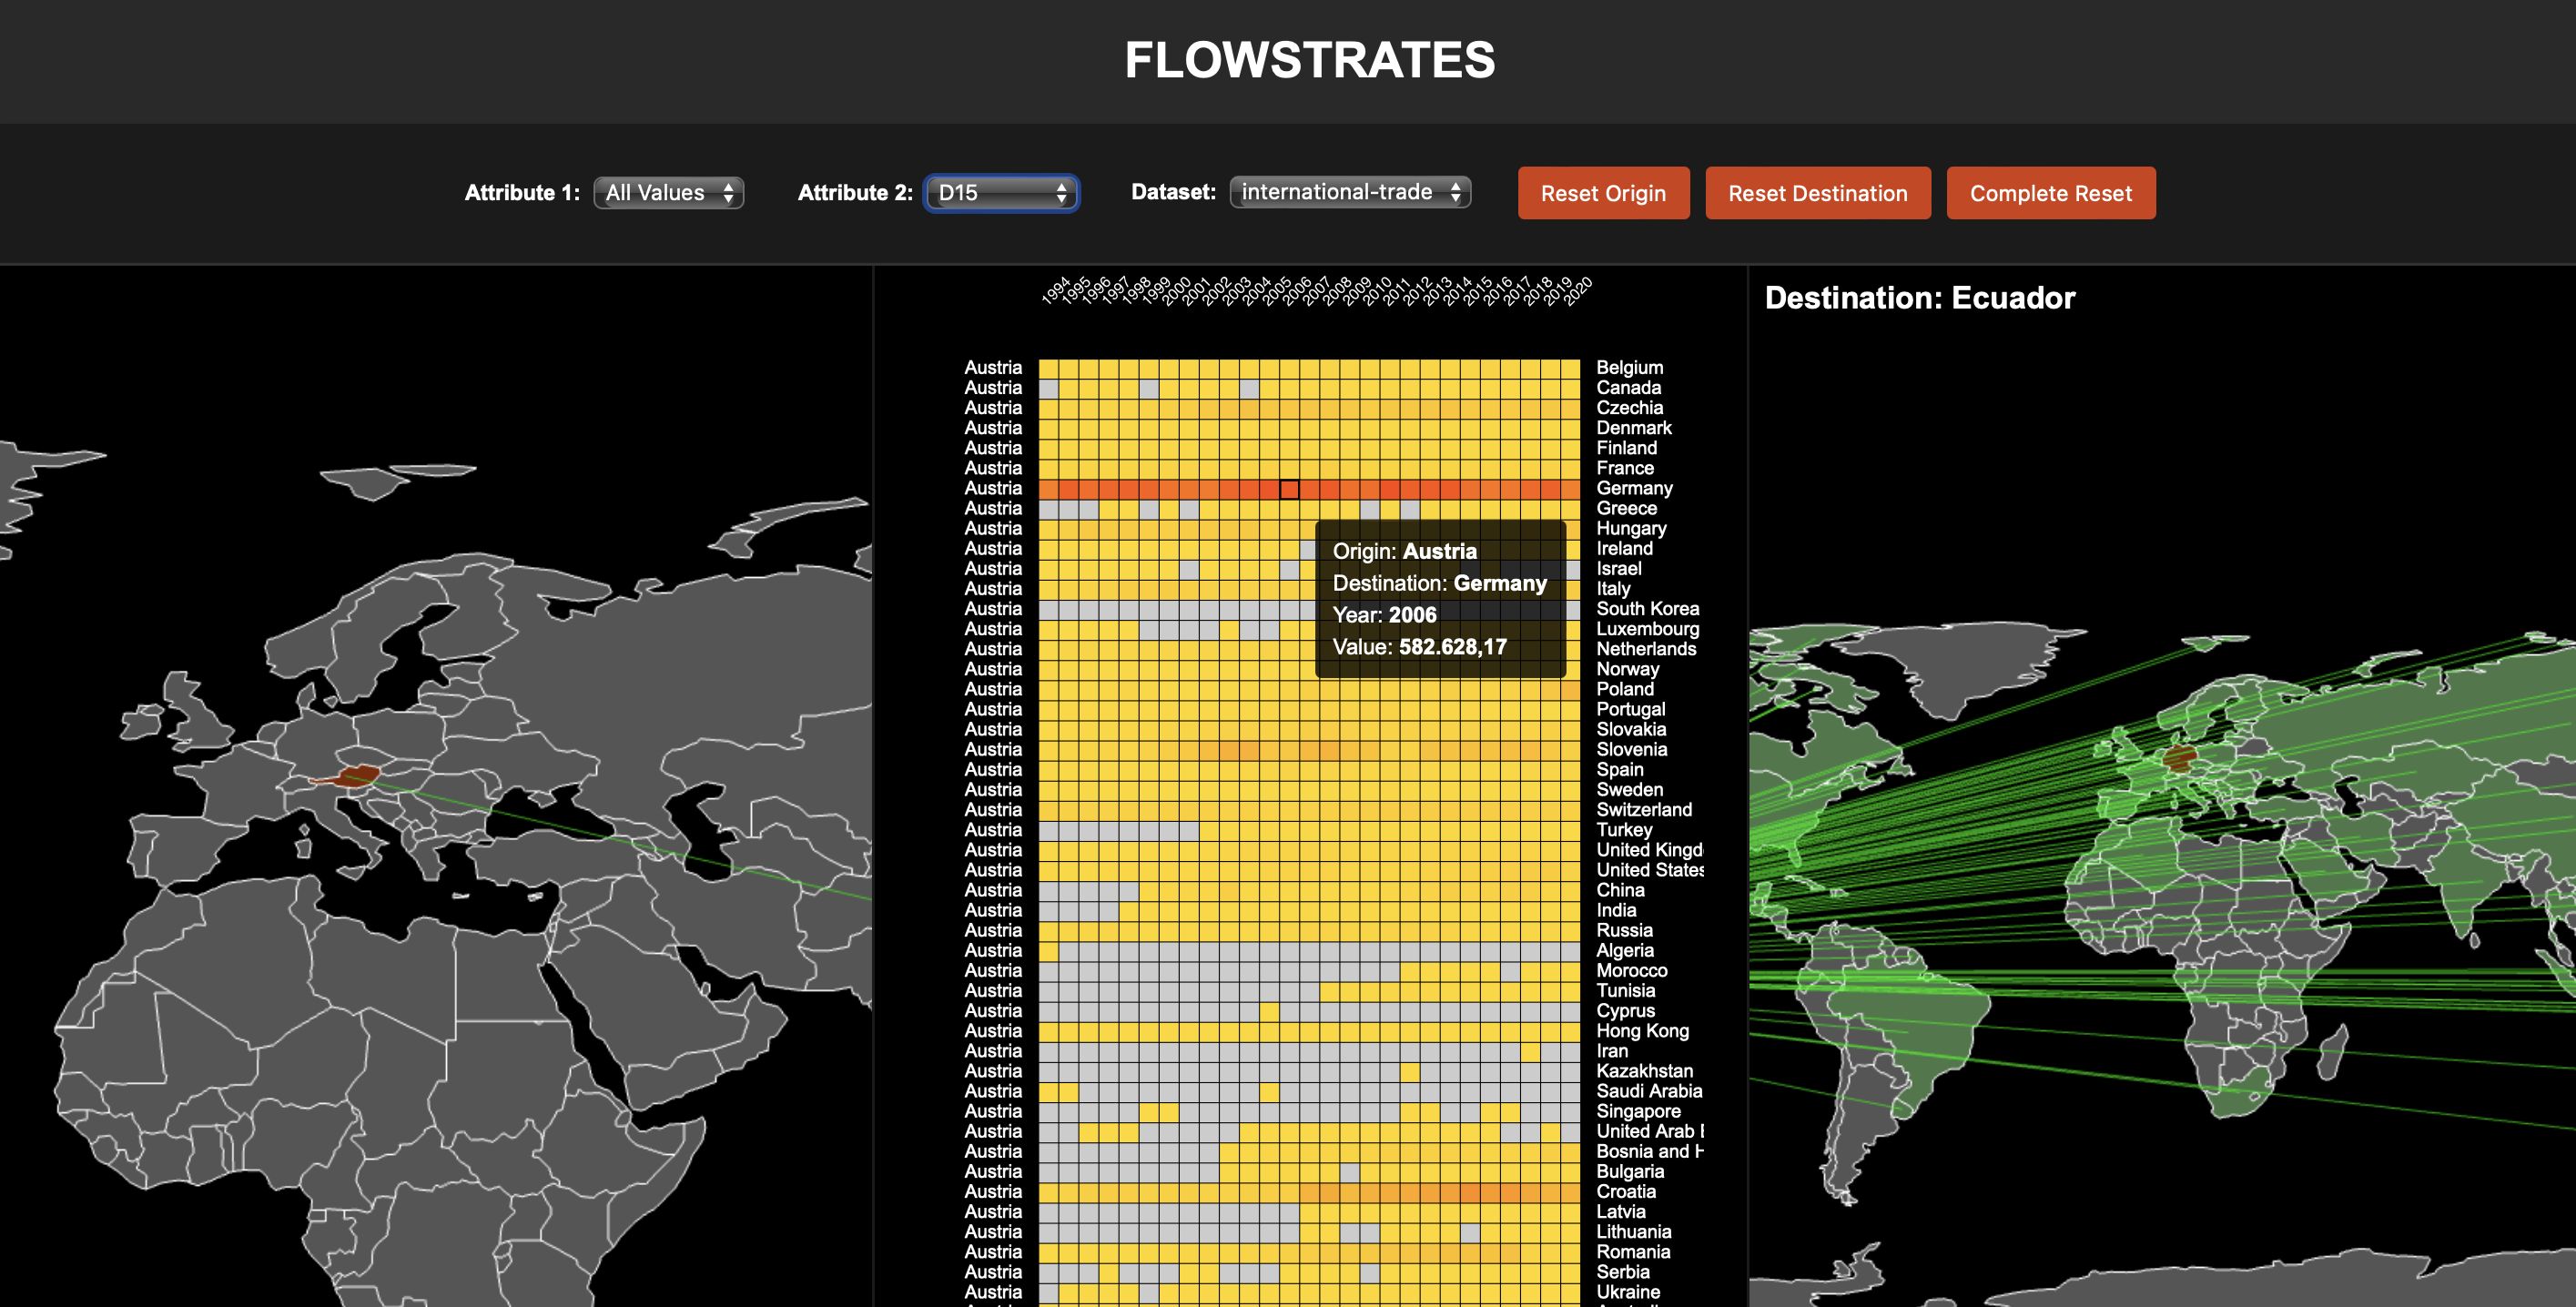
Screenshot
View the source code and documentation on GitHub: Flowstrates GitHub Repository