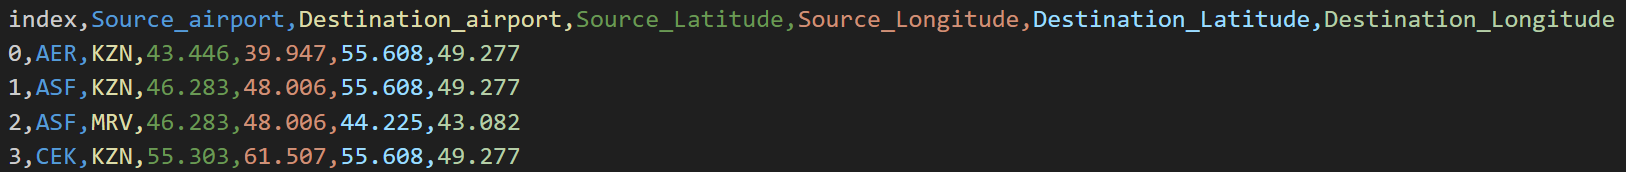
The edge-path bundling process is implemented with TypeScript using vite. First the data is parsed from a .csv file where each line represents a flightpath with source latitude and longitude aswell as destination latitude and longitude. From this data a graph is constructed on which the edge-path bundling algorithm, proposed by Wallinger et al. in the above linked paper, is run.
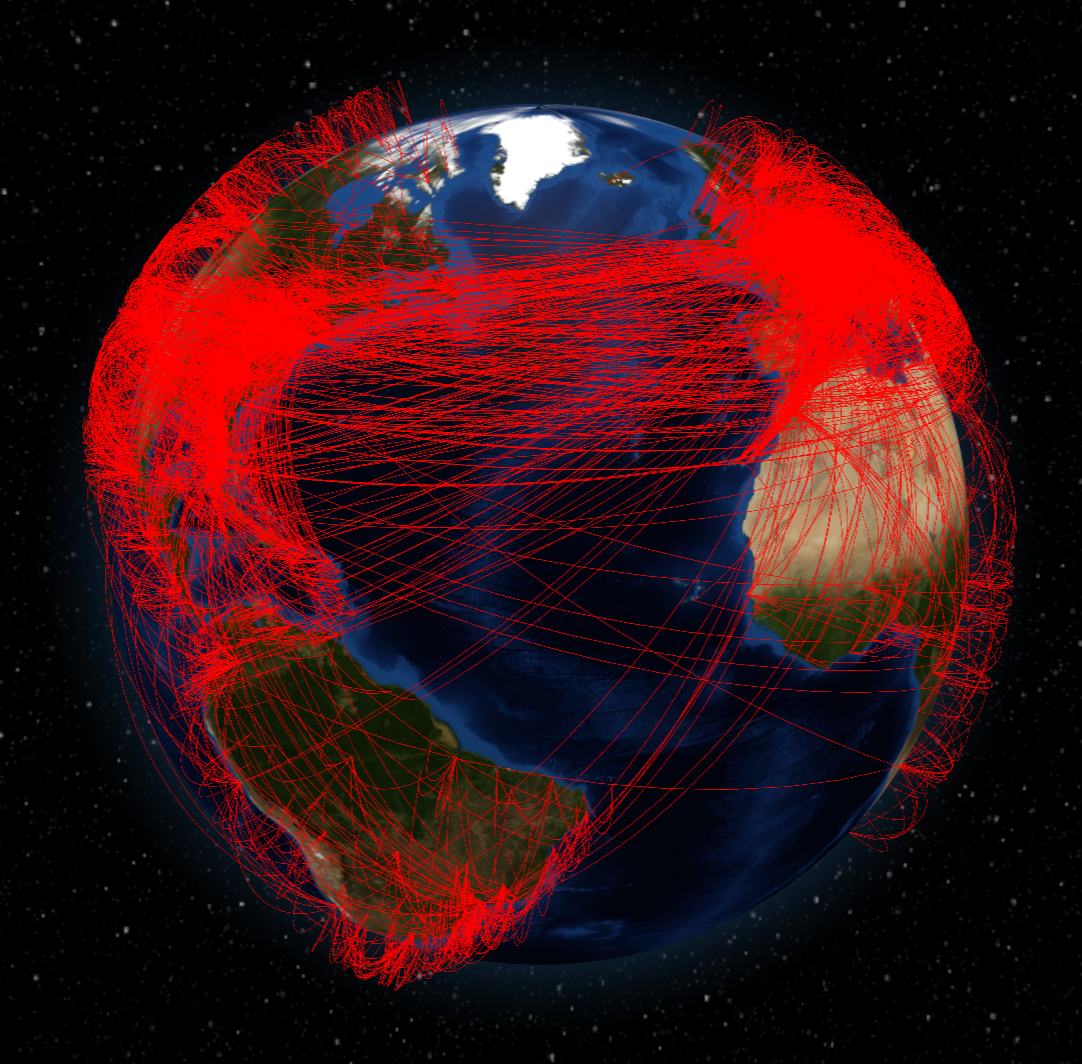
Visualization is achieved using Three.js in combination with Globe.GL. Without the application of edge-path bundling the visualization looks cluttered and confusing. Right now we are drawing the graph as it is - with edges connecting source with destination directly.
In the bundled graph, edges are grouped based on proximity and similarity. Adjustable parameters include:
Edge Weight Factor d: Controls the scaling of the length of the edge in the graph.
Maximum Distortion Threshold k: Determines how much the bundled path is allowed to deviate from the direct route.
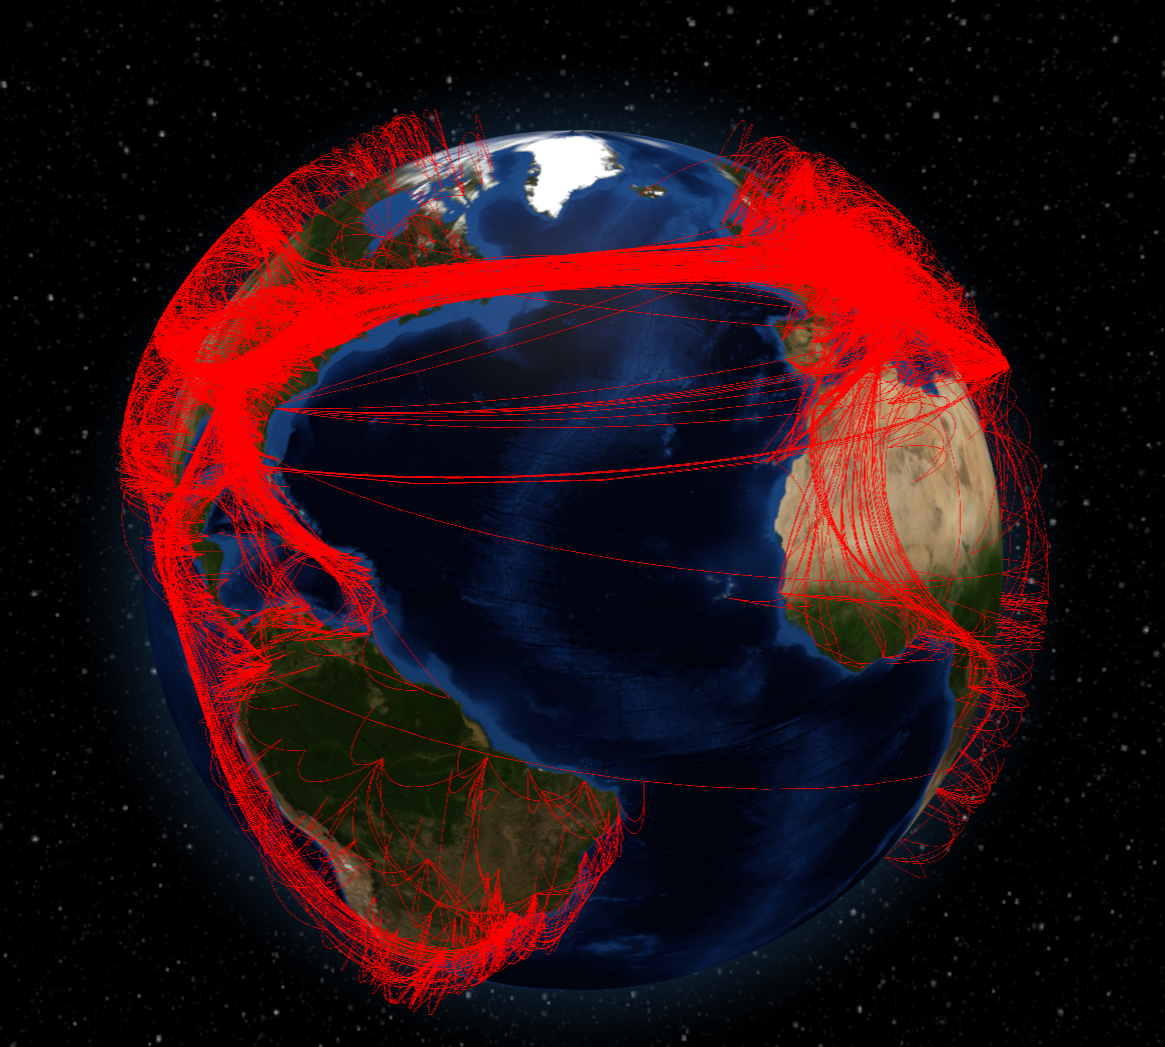
An interesting observation is, that due to bundling, a prominent flightroute: the atlantic highway has become visible just from the data itself. Can be seen in the image below.
Here is the link to the repository that holds the sourcecode, data and everything related to the project:
GitHub Repository
For an in-depth explanation of the code, you can follow this link:
Code Documentation