Welcome to the Phoenixmap🐦🔥 Vis2 project page
This project implements Phoenixmap, a visualization algorithm designed to tackle the problems of visualizing multiple spatial or spatiotemporal distributions at once. The working demo can be found here, the source code and technical documentation here
About the algorithm
The essence of the algorithm is that it assigns an outline to the given data points in a certain way, with varying thickness to represent the density of data points in certain regions. The steps of the algorithm are:
- Compute outline based on the given datapoints (I used the convex hull algorithm for this step).
- Offset the outline by a small number.
- Generate a closed Bezier curve based on the offset hull.
- Divide the curve into a number of segments.
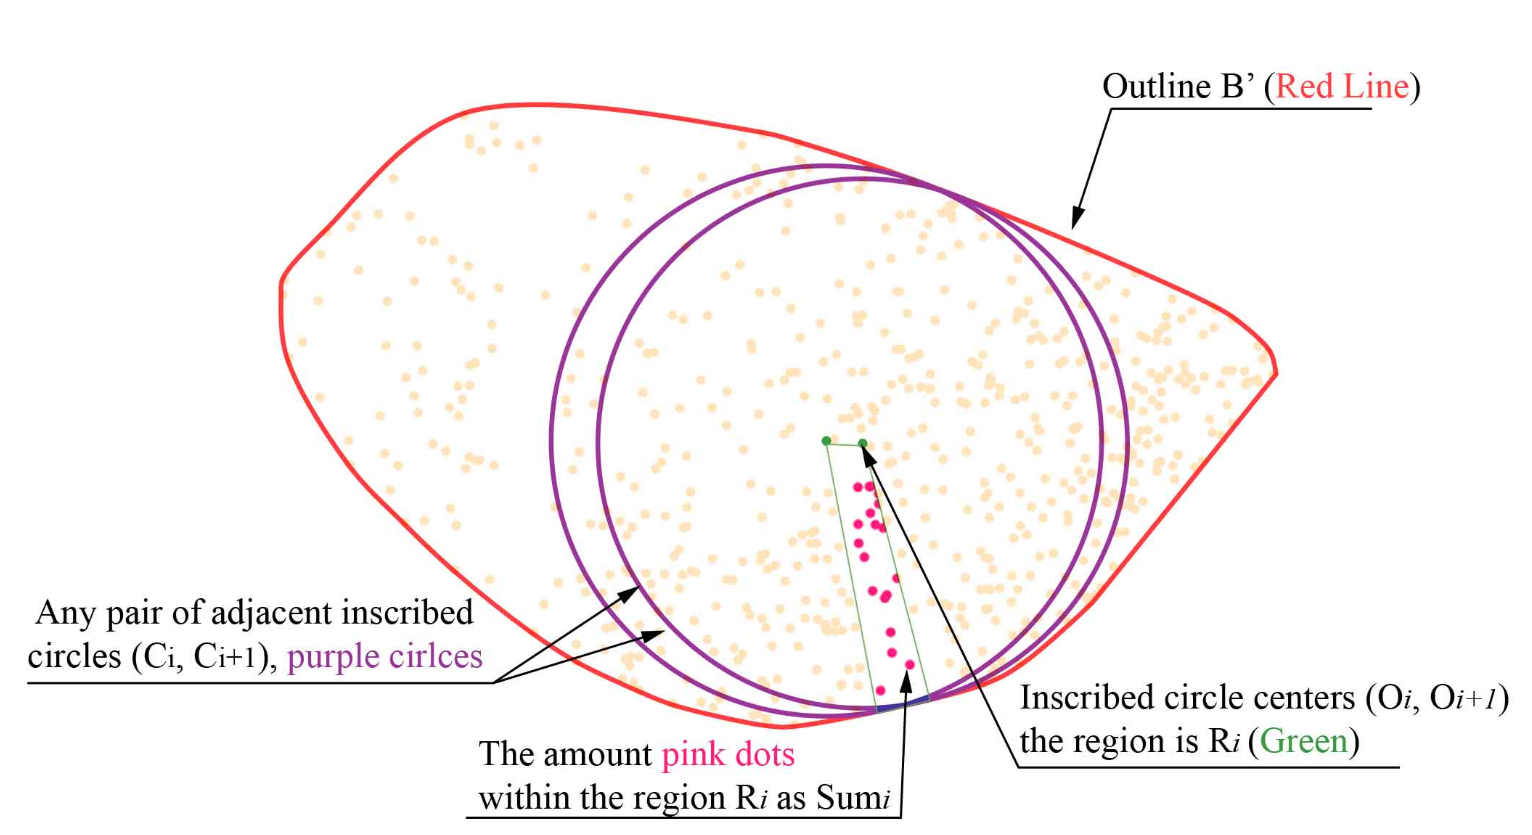
- Find the inscribed circle center for every segment endpoint.
- Define regions connecting every adjacent segment endpoints with their inscribed circle centers.
- Compute the density for every such region, divide the number of datapoints in that region by the area of it.
- Use weighted arithmetic mean with a specific window size to smooth the densities along the curve.
- Assign these density values to the stroke widths of the Bezier segments.
- You have a Phoenixmap🎉
Use Cases
For my visualization, I used three different datasets: rat sightings in New York between 2010 and 2017, meteorite landings, and fires in Oregon between 2000 and 2022. Each dataset corresponds to a different use case:
- Rat sightings mode: A slider allows you to select which year's sightings should be displayed via Phoenixmap, and there is a switch to toggle the display of individual sighting locations.
- Meteorites mode: The user can create arbitrary polygons by clicking on the map, each selected point is connected to the previous one until the shape is closed. The program then filters the meteorites that were within the selected region and visualizes them using the Phoenixmap algorithm.
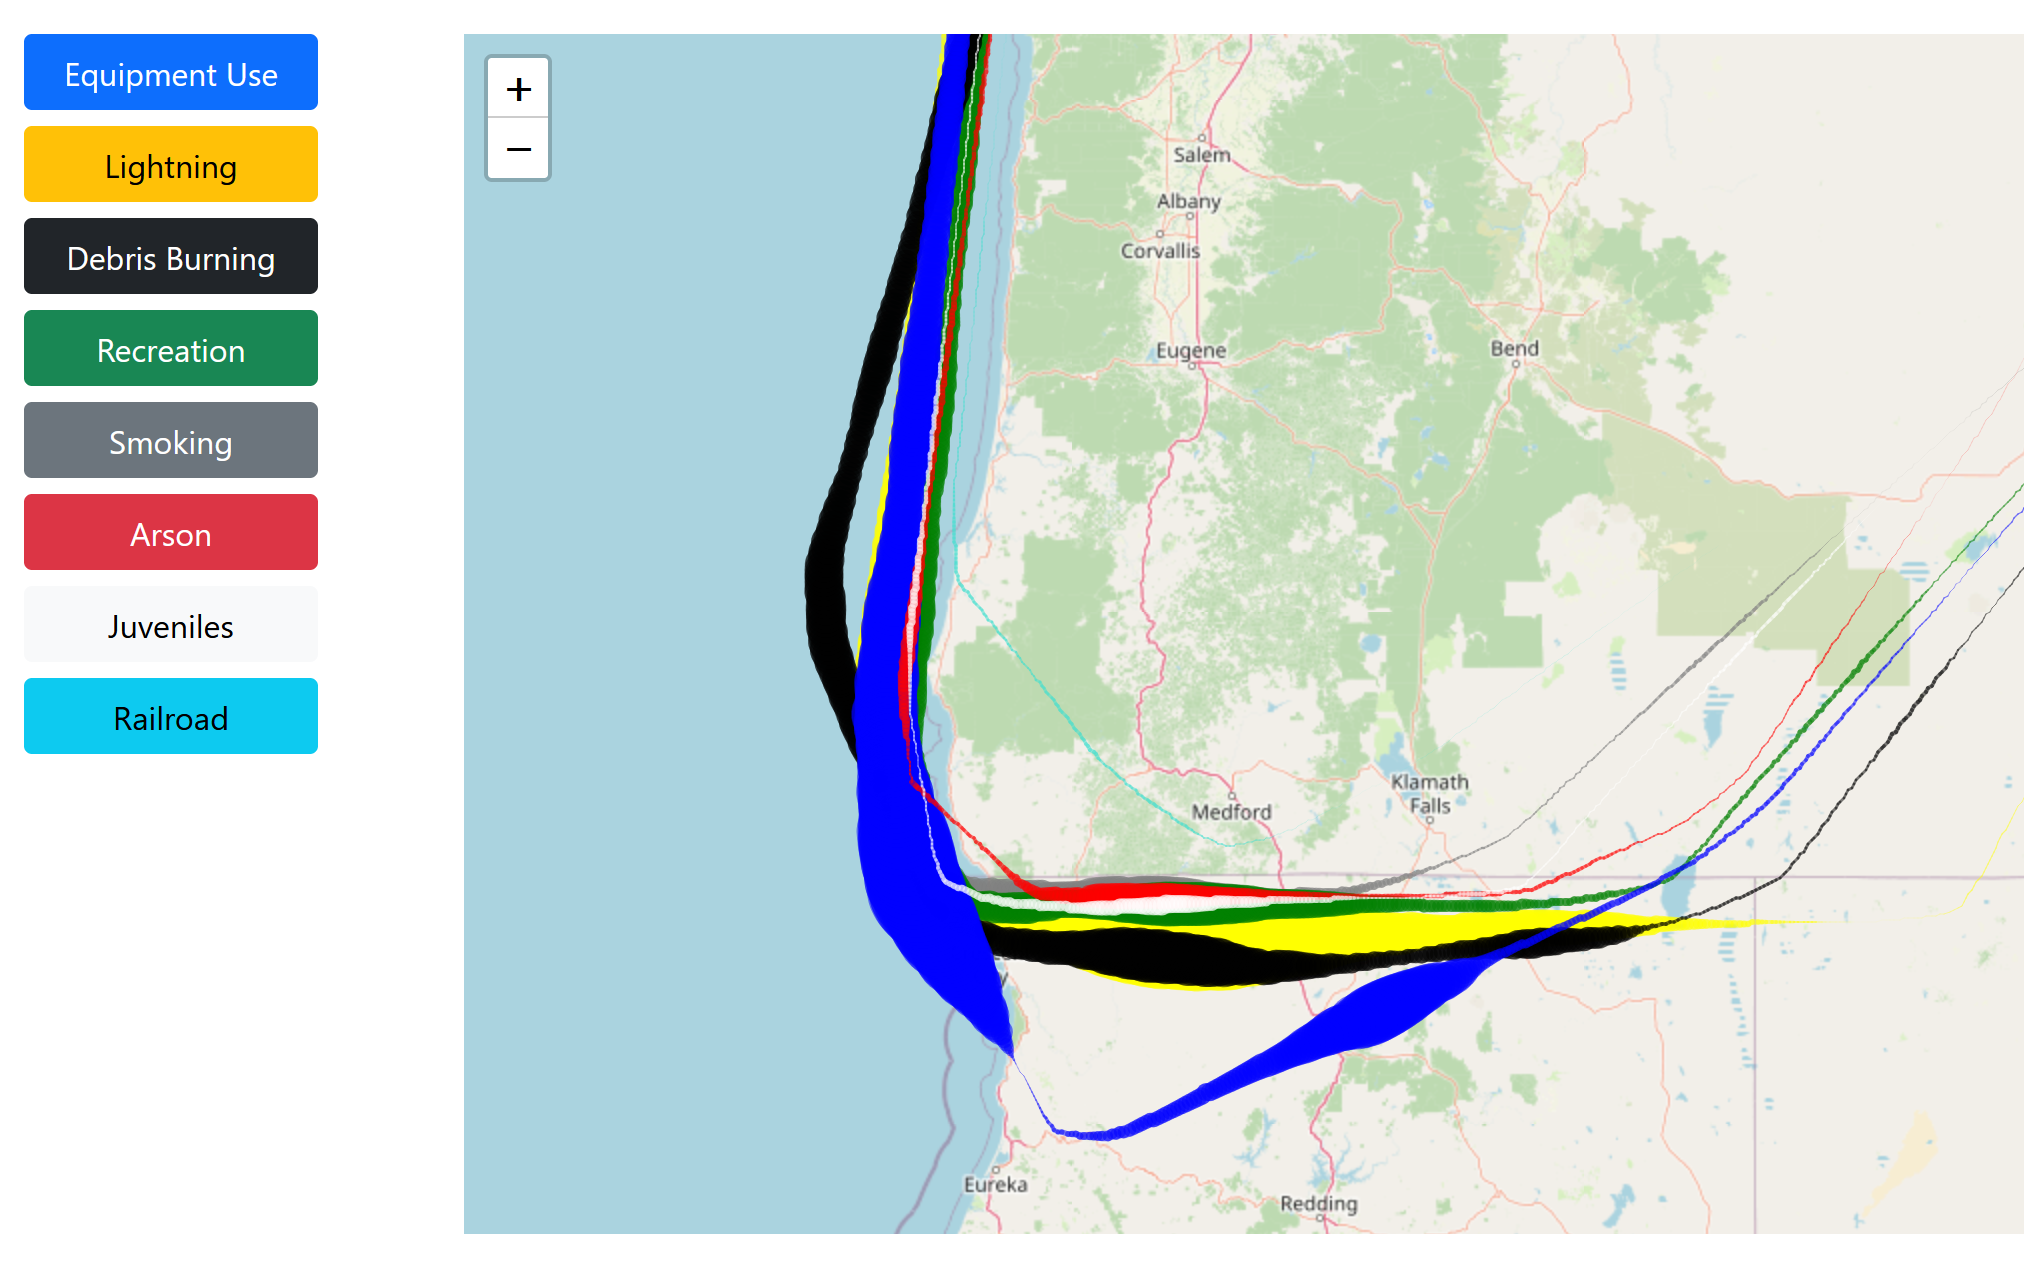
- Fire occurrences mode: Fire occurrences are grouped by their cause, with 8 differently colored Phoenixmaps representing them, making it easier to compare multiple spatial distributions at once. The Phoenixmaps for each category can be hidden and shown as desired.
Reference: Zhao, Junhan, et al. "Phoenixmap: An abstract approach to visualize 2d spatial distributions." IEEE Transactions on Visualization and Computer Graphics 27.3 (2019): 2000-2014.