News
All information about the lecture (Zoom links, slides, etc) can be found on TUWEL.
Please post all questions about the lecture in the TUWEL forum.
Content
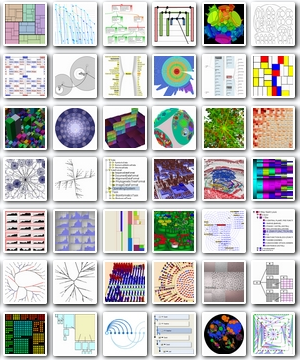
The VU Visual Data Science will discuss how data scientists can apply visualization and Visual Analytics techniques in the data science workflow. The lecture will start with a theoretical introduction to visualization and Visual Analytics concepts. The second part of the lecture will deal with the practical application of Visual Data Science, namely the integration of visualization in the data science workflow, selection of charts, and a comparison of current applications and libraries. The lecture concludes with the late-breaking research topics of trust in visual interpretation and how to combine AI methods and visualization.
Lectures
Important information about the lectures:
- All lectures are hybrid and will be recorded.
- Hybrid lectures take place in HS 13 Ernst Melan in the main building of the TU Wien.
- Lectures will be only 60min. The remaining 30min minutes will be dedicated to solving practical questions in TUWEL. This can be done either directly in the lecture room afterwards, or later on.
- Lecture 3 (Oct 18th) and 4 (Oct 25th) will be presented as a pre-recorded video in TUWEL, since Johanna Schmidt attends a conference on these days.
| # | Date | Time | Type | Title |
|---|---|---|---|---|
| L1 | 04.10.2023 | 11:00 - 12:00 | Hybrid Lecture (HS 13 & Zoom) | Introduction & Information Visualisation Basics for the visual display of information |
| L2 | 11.10.2023 | 11:00 - 12:00 | Hybrid Lecture (HS 13 & Zoom) | Human Perception How humans perceive data visualisations |
| L3 | 18.10.2023 | available from 11:00 on | Pre-recorded video | Data Science Workflow How to structure the data science workflow |
| L4 | 25.10.2023 | available from 11:00 on | Pre-recorded video | Applications & Libraries I Charting Libraries |
| 01.11.2023 | no lexture (lecture-free day) | |||
| 08.11.2023 | no lexture | |||
| 15.11.2023 | no lexture (lecture-free day) | |||
| L5 | 22.11.2023 | 11:00 - 12:00 | Hybrid Lecture (HS 13 & Zoom) | Applications & Libraries II Applications |
| L6 | 29.11.2023 | 11:00 - 12:00 | Hybrid Lecture (HS 13 & Zoom) | Usage of Charts and Plots in Data Science How to select the right chart based on the data? |
| L7 | 06.12.2023 | 11:00 - 12:00 | Hybrid Lecture (HS 13 & Zoom) | Scalability and Interaction Techniques for dealing with large amounts of data |
| L8 | 13.12.2023 | 11:00 - 12:00 | Hybrid Lecture (HS 13 & Zoom) | Interaction, Mobile & Tool Comparison Visualization on different devices and tool comparison |
| L9 | 20.12.2023 | 11:00 - 12:00 | Hybrid Lecture (HS 13 & Zoom) | Trust in Visualisation How to correctly interpret what we see? |
| 27.12.2023 | no lecture (lecture free day) | |||
| 03.01.2024 | no lecture (lecture free day) | |||
| L10 | 10.01.2024 | 11:00 - 12:00 | Hybrid Lecture (HS 13 & Zoom) | AI in Visualisation Visualisation for understanding AI & Using AI for better visualisations |
Important Dates
Submissions are done via TUWEL.
Every data science workflow consists of five stages: Discover, Wrangle, Profile, Model, and Report. The submission dates reflect these stages. The first submissions (Discover) on Nov 17th is mandatory to be enrolled to the lecture. A submission of this lab part will also mean that a certificate for this lecture will be issued. For submitting practical exams, the following deadlines apply:
| Date & Time | Description | |
|---|---|---|
| 17.11.2023 23:59 | MANDATORY | Discover - submission of short report (at least 1 A4 page) |
| 06.12.2023 23:59 | V-LAT Test 1 | |
| 20.12.2023 23:59 | Wrangle & Profile - submission of report (at least 3-4 A4 pages) | |
| 10.01.2024 23:59 | Model - submission of a report (at least 1-2 A4 pages) | |
| 17.01.2024 23:59 | Report - submission of video (5min) | |
| 24.01.2024 23:59 | V-LAT Test 2 | |
| 18.01.2024 - 02.02.2024 | Possibility for presentations |
Grading
The following points can be achieved in the lecture:
| Part | Points |
| Interactive lecture part (TUWEL) | 20 points |
| Discover | 10 points |
| Wrangle & Profile | 30 points |
| Wrangle & Profile - Data Quality Analysis | 10 points |
| Model | 10 points |
| Report | 30 points |
| Report - Brushing+Linking Interaction | 10 points |
| Report - Live presentation of the dashboard | 10 points |
| V-LAT Test 1 | 5 points |
| V-LAT Test 2 | 5 points |
| Both V-LAT Tests have been done | 10 points |
| 150 points |
The points define the final grade:
| Sehr Gut (1) | > 85 points |
| Gut (2) | > 75 points |
| Befriedigend (3) | > 62 points |
| Genügend (4) | > 50 points |
| Nicht Genügend (5) | <= 50 points |
