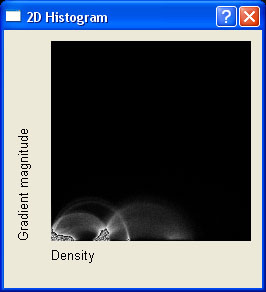
With View > 2D histogram a wigdet showing the 2d histogram of the volume can be opened. The x-axis defines the density value and y-axis defines the gradient magnitude. The brighter a point is the more voxels with these values occur in the volume.
The image shows the 2d histogram of the volume skewed_head.dat
The 1D histograms of the density values and the gradient magnitudes are displayed in the widgets for the transfer functions.