Information
- Publication Type: Conference Paper
- Workgroup(s)/Project(s):
- Date: July 2008
- Location: London, UK
- Lecturer: Kresimir Matkovic
- Booktitle: Proceedings of the 12th International Conference Information Visualisation
- Keywords: visualization tool, visual analysis, information visualization, system design
Abstract
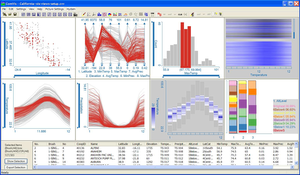
There is a large number of interactive visualization tools, however no universal tool exists that covers all relevant aspects for all possible application domains. We have developed a tool, ComVIs, which was intended to be used as a research prototype for new visualization techniques. We have identified some interesting aspects from developers and users point of view during tool development. In this paper we describe lessons learned during the process, and share our findings with visualization research community. Examples at the end prove the usefulness of the developed tool. One particular example, the concept of families of function graphs and application to analysis of fuel injection concludes the paper.Additional Files and Images
Weblinks
No further information available.BibTeX
@inproceedings{Matkovic-2008-ComVis,
  title =      "ComVis: a Coordinated Multiple Views System for Prototyping
               New Visualization Technology",
  author =     "Kresimir Matkovic and Wolfgang Freiler and Denis Gracanin
               and Helwig Hauser",
  year =       "2008",
  abstract =   "There is a large number of interactive visualization tools,
               however no universal tool exists that covers all relevant
               aspects for all possible application domains. We have
               developed a tool, ComVIs, which was intended to be used as a
               research prototype for new visualization techniques. We have
               identified some interesting aspects from developers and
               users point of view during tool development. In this paper
               we describe lessons learned during the process, and share
               our findings with visualization research community. Examples
               at the end prove the usefulness of the developed tool. One
               particular example, the concept of families of function
               graphs and application to analysis of fuel injection
               concludes the paper.",
  month =      jul,
  location =   "London, UK",
  booktitle =  "Proceedings of the 12th International Conference Information
               Visualisation",
  keywords =   "visualization tool, visual analysis, information
               visualization, system design",
  URL =        "https://www.cg.tuwien.ac.at/research/publications/2008/Matkovic-2008-ComVis/",
}


 image
image
