

Ranko Miklin, Tomislav Lipic, Zoltan Konyha, Mario Beric, Wolfgang Freiler, Kresimir Matkovic , Denis Gracanin
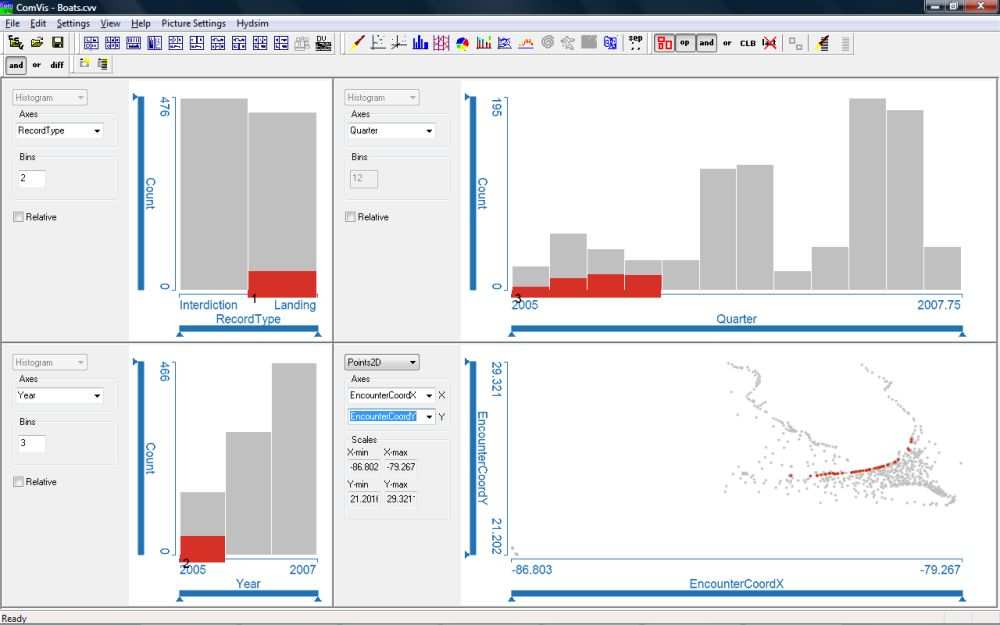
Migrant Boat Mini Challenge Award: Simple and Effective Integrated Display Geo-Temporal Analysis of Migrant Boats
In Proceedings of IEEE VAST 2008 Symposium. 2008.
[image] [ paper]
Information
- Publication Type: Other Reviewed Publication
- Workgroup(s)/Project(s):
- Date: 2008
- Booktitle: Proceedings of IEEE VAST 2008 Symposium
- Location: Columbus, Ohio
- Conference date: 19. October 2008 – 24. October 2008
- Keywords: geo-temporal data, visual analytics
Abstract
We provide a description of the tools and techniques used in our analysis of the VAST 2008 Challenge dealing with mass movement of persons departing Isla Del Sue˜no on boats for the United States during 2005–2007. We used visual analytics to explore migration patterns, characterize the choice and evolution of landing sites, characterize the geographical patterns of interdictions and determine the successful landing rate. Our ComVis tool, in connection with some helper applications and Google Earth, allowed us to explore geo-temporal characteristics of the data set and answer the challenge questions. The ComVis project file captures the visual analysis context and facilitates better collaboration among team members.Additional Files and Images

Weblinks
No further information available.BibTeX
@inproceedings{Miklin-2009-Mig,
  title =      "Migrant Boat Mini Challenge Award: Simple and Effective
               Integrated Display Geo-Temporal Analysis of Migrant Boats",
  author =     "Ranko Miklin and Tomislav Lipic and Zoltan Konyha and Mario
               Beric and Wolfgang Freiler and Kresimir Matkovic and Denis
               Gracanin",
  year =       "2008",
  abstract =   "We provide a description of the tools and techniques used in
               our analysis of the VAST 2008 Challenge dealing with mass
               movement of persons departing Isla Del Sue˜no on boats for
               the United States during 2005–2007. We used visual
               analytics to explore migration patterns, characterize the
               choice and evolution of landing sites, characterize the
               geographical patterns of interdictions and determine the
               successful landing rate. Our ComVis tool, in connection with
               some helper applications and Google Earth, allowed us to
               explore geo-temporal characteristics of the data set and
               answer the challenge questions. The ComVis project file
               captures the visual analysis context and facilitates better
               collaboration among team members.",
  booktitle =  "Proceedings of IEEE VAST 2008 Symposium",
  location =   "Columbus, Ohio",
  keywords =   "geo-temporal data, visual analytics",
  URL =        "https://www.cg.tuwien.ac.at/research/publications/2008/Miklin-2009-Mig/",
}