Information
- Publication Type: Master Thesis
- Workgroup(s)/Project(s):
- Date: September 2008
- TU Wien Library:
- Diploma Examination: September 2008
- First Supervisor:
Abstract
This paper and its accompanying application address several methods for visualizing previously segmented Magnetic Resonance Imaging (MRI) heart data. Several parameters are computed from this data, which are then represented in a properly constructed 3D environment.
The heart data is structured into a series of datasets, each corresponding to a phase in the time-span of a heartbeat, and each consisting of several slices through the cross-section of the heart. These datasets are segmented semi-automatically, to outline the inner and outer layers of the myocardium (the endocardium and the epicardium, respectively), and the resulting contours are then used to construct a 3D mesh which closely approximate the walls of the myocardium. Five parameters are then derived from the data, namely wall thickness, wall thickening, motion speed, distance from the center and moment of maximum thickness. The values of these parameters are represented comparatively on the surface of the previously constructed mesh, though use of color or graphical noise, rendering visible any anomalies which might indicate possible problems with the proper functioning of the heart.
One of the focal issues is the visualization of two or more parameters concurrently, on the same surface, in real-time, without visually overloading the representation. This is achieved through various techniques such as the use of noise textures, a lens tool, or fading in-out between two different parameters.
Data containing a number of distinct stress levels is also visualized. In addition to the previous techniques, it is possible to represent parameters for all stress levels on a single mesh, through the use of “stress bands”. Moreover, the mesh be clipped above a desired stress band, thus viewing the parameter in relation to the motion of the heart.
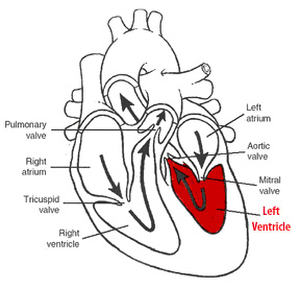
These means of visually characterizing the behavior of the heart in motion, specifically, the left ventricle, yield satisfactory results, making it possible to detect anomalies and dyssynchronies among the various regions of the myocardium, which are typically indicators of heart-related disease.
Additional Files and Images
Additional images and videos
Additional files
Weblinks
No further information available.
BibTeX
@mastersthesis{gavrilescu-2008-vsc,
  title =      "Visualization of  Segmented Cine Data ",
  author =     "Marius Gavrilescu",
  year =       "2008",
  abstract =   "This paper and its accompanying application address several
               methods for visualizing previously segmented Magnetic
               Resonance Imaging (MRI) heart data. Several parameters are
               computed from this data, which are then represented in a
               properly constructed 3D environment.  The heart data is
               structured into a series of datasets, each corresponding to
               a phase in the time-span of a heartbeat, and each consisting
               of several slices through the cross-section of the heart.
               These datasets are segmented semi-automatically, to outline
               the inner and outer layers of the myocardium (the
               endocardium and the epicardium, respectively), and the
               resulting contours are then used to construct a 3D mesh
               which closely approximate the walls of the myocardium. Five
               parameters are then derived from the data, namely wall
               thickness, wall thickening, motion speed, distance from the
               center and moment of maximum thickness. The values of these
               parameters are represented comparatively on the surface of
               the previously constructed mesh, though use of color or
               graphical noise, rendering visible any anomalies which might
               indicate possible problems with the proper functioning of
               the heart. One of the focal issues is the visualization of
               two or more parameters concurrently, on the same surface, in
               real-time, without visually overloading the representation.
               This is achieved through various techniques such as the use
               of noise textures, a lens tool, or fading in-out between two
               different parameters. Data containing a number of distinct
               stress levels is also visualized. In addition to the
               previous techniques, it is possible to represent parameters
               for all stress levels on a single mesh, through the use of
               “stress bands”. Moreover, the mesh be clipped above a
               desired stress band, thus viewing the parameter in relation
               to the motion of the heart.   These means of visually
               characterizing the behavior of the heart in motion,
               specifically, the left ventricle, yield satisfactory
               results, making it possible to detect anomalies and
               dyssynchronies among the various regions of the myocardium,
               which are typically indicators of heart-related disease. ",
  month =      sep,
  address =    "Favoritenstrasse 9-11/E193-02, A-1040 Vienna, Austria",
  school =     "Institute of Computer Graphics and Algorithms, Vienna
               University of Technology ",
  URL =        "https://www.cg.tuwien.ac.at/research/publications/2008/gavrilescu-2008-vsc/",
}

 image
image paper
paper

