Information
- Publication Type: Master Thesis
- Workgroup(s)/Project(s):
- Date: January 2009
- TU Wien Library:
- Diploma Examination: January 2009
- First Supervisor:
Abstract
Non-destructive testing (NDT) is a key aspect of present day engineering and development
which examines the internal structures of industrial components such as
machine parts, pipes and ropes without destroying them. Industrial pieces require
critical inspection before they are assembled into a finished product in order to
ensure safety, stability, and usefulness of the finished object. Therefore, the goal of
this thesis is to explore industrial Computed Tomography (CT) volumes, with the
goal to facilitate the whole quantification approach of the components at hand by
bridging the gap between visualization on the one hand, and interactive quantification
of features or defects on the other one.
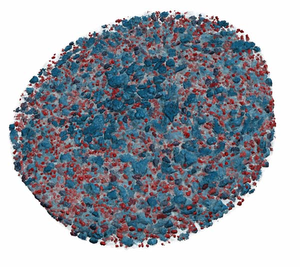
The standard approach for defect detection in industrial CT builds on region growing,
which requires manually tuning parameters such as target ranges for density and size,
variance, as well as sometimes also the specification of seed points. To circumvent
repeating the whole process if the region growing results are not satisfactory, the
method presented in this thesis allows interactive exploration of the parameter
space. The exploration process is completely separated from region growing in
an unattended pre-processing stage where the seeds are set automatically. The
pre-computation results in a feature volume that tracks a feature size curve for
each voxel over time, which is identified with the main region growing parameter
such as variance. Additionally, a novel 3D transfer function domain over (density,
feature size, time) is presented which allows for interactive exploration of feature
classes. Features and feature size curves can also be explored individually, which
helps with transfer function specification and allows coloring individual features and
disabling features resulting from CT artifacts. Based on the classification obtained
through exploration, the classified features can be quantified immediately.
The visualization and quantification results of this thesis are demonstrated on
different real-world industrial CT data sets.
Additional Files and Images
Additional images and videos
Additional files
Weblinks
No further information available.
BibTeX
@mastersthesis{fritz-2009-ieq,
  title =      "Interactive Exploration and Quantification of Industrial CT
               Data",
  author =     "Laura Fritz",
  year =       "2009",
  abstract =   "Non-destructive testing (NDT) is a key aspect of present day
               engineering and development which examines the internal
               structures of industrial components such as machine parts,
               pipes and ropes without destroying them. Industrial pieces
               require critical inspection before they are assembled into a
               finished product in order to ensure safety, stability, and
               usefulness of the finished object. Therefore, the goal of
               this thesis is to explore industrial Computed Tomography
               (CT) volumes, with the goal to facilitate the whole
               quantification approach of the components at hand by
               bridging the gap between visualization on the one hand, and
               interactive quantification of features or defects on the
               other one. The standard approach for defect detection in
               industrial CT builds on region growing, which requires
               manually tuning parameters such as target ranges for density
               and size, variance, as well as sometimes also the
               specification of seed points. To circumvent repeating the
               whole process if the region growing results are not
               satisfactory, the method presented in this thesis allows
               interactive exploration of the parameter space. The
               exploration process is completely separated from region
               growing in an unattended pre-processing stage where the
               seeds are set automatically. The pre-computation results in
               a feature volume that tracks a feature size curve for each
               voxel over time, which is identified with the main region
               growing parameter such as variance. Additionally, a novel 3D
               transfer function domain over (density, feature size, time)
               is presented which allows for interactive exploration of
               feature classes. Features and feature size curves can also
               be explored individually, which helps with transfer function
               specification and allows coloring individual features and
               disabling features resulting from CT artifacts. Based on the
               classification obtained through exploration, the classified
               features can be quantified immediately. The visualization
               and quantification results of this thesis are demonstrated
               on different real-world industrial CT data sets.",
  month =      jan,
  address =    "Favoritenstrasse 9-11/E193-02, A-1040 Vienna, Austria",
  school =     "Institute of Computer Graphics and Algorithms, Vienna
               University of Technology ",
  URL =        "https://www.cg.tuwien.ac.at/research/publications/2009/fritz-2009-ieq/",
}

 image
image paper
paper

