

Martin Haidacher
Information-based Feature Enhancement in Scientific Visualization
Supervisor: Eduard Gröller
Duration: October 2007 — June 2011
[ PhD Thesis]
Information
- Publication Type: PhD-Thesis
- Workgroup(s)/Project(s):
- Date: 2011
- Date (Start): October 2007
- Date (End): June 2011
- TU Wien Library:
- 1st Reviewer: Eduard Gröller
- 2nd Reviewer: Timo Ropinski
- Rigorosum: 17. June 2011
- First Supervisor: Eduard Gröller
- Keywords: Scientific visualization, Information theory, Volume classification
Abstract
Scientific visualization is a research area which gives insight into volumetric data acquired through measurement or simulation. The visualization allows a faster and more intuitive exploration of the data.Due to the rapid development in hardware for the measurement and simulation of scientific data, the size and complexity of data is constantly increasing. This has the benefit that it is possible to get a more accurate insight into the measured or simulated phenomena. A drawback of the increasing data size and complexity is the problem of generating an expressive representation of the data.
Since only certain parts of the data are necessary to make a decision, it is possible to mask parts of the data along the visualization pipeline to enhance only those parts which are important in the visualization. For the masking various properties are extracted from the data which are used to classify a part as important or not. In general a transfer function is used for this classification process which has to be designed by the user.
In this thesis three novel approaches are presented which use methods from information theory and statistics to enhance features from the data in the classification process that are important for a certain task. With the tools of information theory and statistics it is possible to extract properties from the data which are able to classify different materials or tissues in the data better than comparable other approaches.
One approach adaptively extracts statistical properties, i.e. the mean value and the standard deviation, of the data values in the local neighborhood of each point in the data set. With these statistical properties it is possible to better distinguish between different materials in a data set even though the data is very noisy.
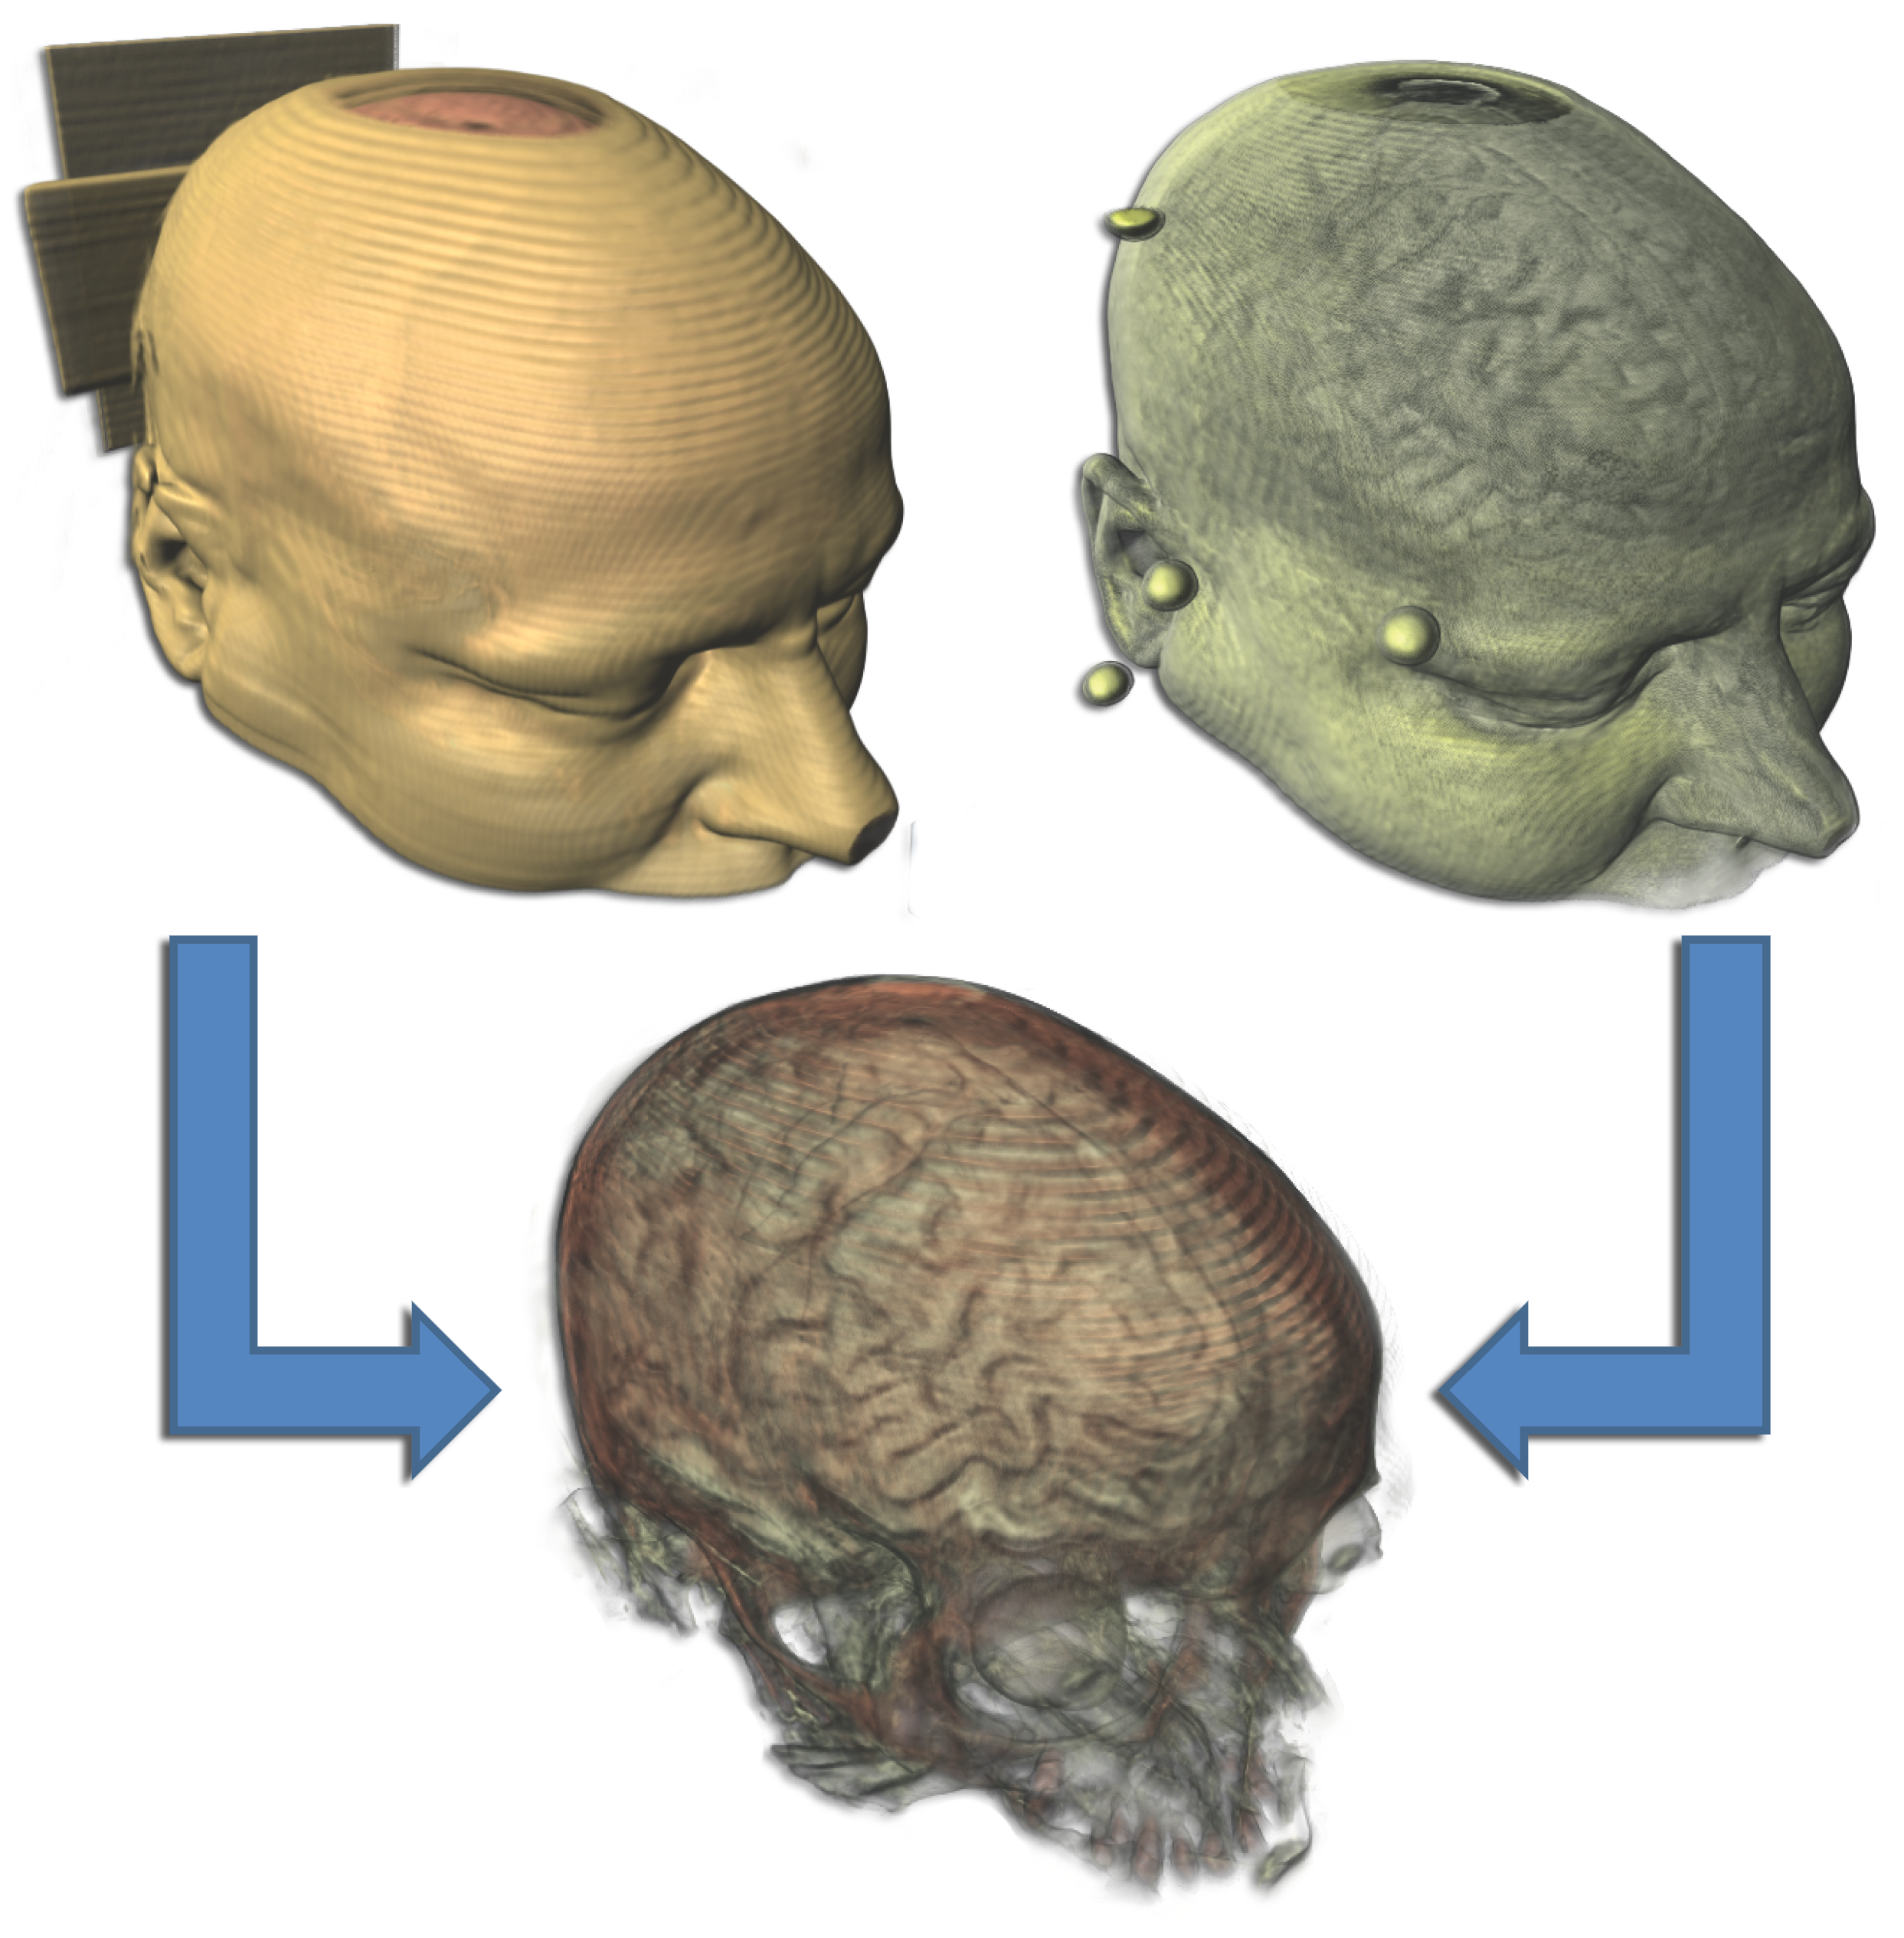
The other two approaches in this thesis employ methods from information theory to extract features from multimodal data sets. Thus it is possible to enhance features of the data which are either very similar or very dissimilar in both modalities. Through information theory the variations in the value ranges of both modalities do not influence the classification of these features.
All three approaches define novel transfer-function spaces which simplify the design process of a transfer function for the user. Different features of the data, such as different materials, can be clearly depicted in these spaces. Therefore, it is easier for a user to design a transfer function which enhances the features of importance for a certain task.
For each of the new approaches results and comparisons to other existing techniques are shown to highlight the usefulness of the proposed methods. Through the described research it is shown that information theory and statistics are tools which are able to extract expressive properties from the data.
In the introduction a broad overview over scientific visualization and the visualization pipeline is given. The classification process is described in more detail. Since information theory and statistics play an important role for all three approaches, a brief introduction to these concepts is given as well.
Additional Files and Images

Weblinks
No further information available.BibTeX
@phdthesis{haidacher-2011-phd,
  title =      "Information-based Feature Enhancement in Scientific
               Visualization",
  author =     "Martin Haidacher",
  year =       "2011",
  abstract =   "Scientific visualization is a research area which gives
               insight into volumetric data acquired through measurement or
               simulation. The visualization allows a faster and more
               intuitive exploration of the data.  Due to the rapid
               development in hardware for the measurement and simulation
               of scientific data, the size and complexity of data is
               constantly increasing. This has the benefit that it is
               possible to get a more accurate insight into the measured or
               simulated phenomena. A drawback of the increasing data size
               and complexity is the problem of generating an expressive
               representation of the data.  Since only certain parts of the
               data are necessary to make a decision, it is possible to
               mask parts of the data along the visualization pipeline to
               enhance only those parts which are important in the
               visualization. For the masking various properties are
               extracted from the data which are used to classify a part as
               important or not. In general a transfer function is used for
               this classification process which has to be designed by the
               user.  In this thesis three novel approaches are presented
               which use methods from information theory and statistics to
               enhance features from the data in the classification process
               that are important for a certain task. With the tools of
               information theory and statistics it is possible to extract
               properties from the data which are able to classify
               different materials or tissues in the data better than
               comparable other approaches.  One approach adaptively
               extracts statistical properties, i.e. the mean value and the
               standard deviation, of the data values in the local
               neighborhood of each point in the data set. With these
               statistical properties it is possible to better distinguish
               between different materials in a data set even though the
               data is very noisy.  The other two approaches in this thesis
               employ methods from information theory to extract features
               from multimodal data sets. Thus it is possible to enhance
               features of the data which are either very similar or very
               dissimilar in both modalities. Through information theory
               the variations in the value ranges of both modalities do not
               influence the classification of these features.  All three
               approaches define novel transfer-function spaces which
               simplify the design process of a transfer function for the
               user. Different features of the data, such as different
               materials, can be clearly depicted in these spaces.
               Therefore, it is easier for a user to design a transfer
               function which enhances the features of importance for a
               certain task.  For each of the new approaches results and
               comparisons to other existing techniques are shown to
               highlight the usefulness of the proposed methods. Through
               the described research it is shown that information theory
               and statistics are tools which are able to extract
               expressive properties from the data.  In the introduction a
               broad overview over scientific visualization and the
               visualization pipeline is given. The classification process
               is described in more detail. Since information theory and
               statistics play an important role for all three approaches,
               a brief introduction to these concepts is given as well.",
  address =    "Favoritenstrasse 9-11/E193-02, A-1040 Vienna, Austria",
  school =     "Institute of Computer Graphics and Algorithms, Vienna
               University of Technology ",
  keywords =   "Scientific visualization, Information theory, Volume
               classification",
  URL =        "https://www.cg.tuwien.ac.at/research/publications/2011/haidacher-2011-phd/",
}