Information
- Publication Type: Conference Paper
- Workgroup(s)/Project(s):
- Date: October 2013
- Publisher: IEEE
- Location: Atlanta
- Lecturer: Johannes Sorger
- Booktitle: Biological Data Visualization (BioVis), 2013 IEEE Symposium on
- Pages: 73 – 80
Abstract
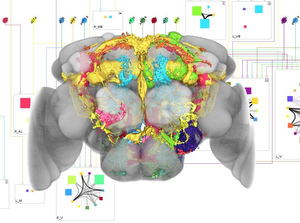
Neuroscientists study the function of neural circuits in the brain of the common fruit fly Drosophila melanogaster to discover how complex behavior is generated. To establish models of neural information processing, knowledge about potential connections between individual neurons is required. Connections can occur when the arborizations of two neurons overlap. Judging connectivity by analyzing overlaps using traditional volumetric visualization is difficult since the examined objects occlude each other. A more abstract form of representation is therefore desirable. In collaboration with a group of neuroscientists, we designed and implemented neuroMap, an interactive two-dimensional graph that renders the brain and its interconnections in the form of a circuit-style wiring diagram. neuroMap provides a clearly structured overview of all possible connections between neurons and offers means for interactive exploration of the underlying neuronal database. In this paper, we discuss the design decisions that formed neuroMap and evaluate its application in discussions with the scientists.Additional Files and Images
Weblinks
No further information available.BibTeX
@inproceedings{sorger-2013-neuromap,
  title =      "neuroMAP - Interactive Graph-Visualization of the Fruit
               Fly's Neural Circuit",
  author =     "Johannes Sorger and Katja B\"{u}hler and Florian Schulze and
               Tianxiao  Liu and Barry Dickson",
  year =       "2013",
  abstract =   "Neuroscientists study the function of neural circuits in the
               brain of the common fruit fly Drosophila melanogaster to
               discover how complex behavior is generated. To establish
               models of neural information processing, knowledge about
               potential connections between individual neurons is
               required. Connections can occur when the arborizations of
               two neurons overlap. Judging connectivity by analyzing
               overlaps using traditional volumetric visualization is
               difficult since the examined objects occlude each other. A
               more abstract form of representation is therefore desirable.
               In collaboration with a group of neuroscientists, we
               designed and implemented neuroMap, an interactive
               two-dimensional graph that renders the brain and its
               interconnections in the form of a circuit-style wiring
               diagram. neuroMap provides a clearly structured overview of
               all possible connections between neurons and offers means
               for interactive exploration of the underlying neuronal
               database. In this paper, we discuss the design decisions
               that formed neuroMap and evaluate its application in
               discussions with the scientists.",
  month =      oct,
  publisher =  "IEEE",
  location =   "Atlanta",
  booktitle =  "Biological Data Visualization (BioVis), 2013 IEEE Symposium
               on ",
  pages =      "73--80",
  URL =        "https://www.cg.tuwien.ac.at/research/publications/2013/sorger-2013-neuromap/",
}


