

 Poster
 Thesis
Information
- Publication Type: Master Thesis
- Workgroup(s)/Project(s):
- Date: May 2015
- TU Wien Library:
- First Supervisor: Eduard Gröller

Abstract
Parameters and the process of setting them play a major role in the world of computer based visualisation, no matter whether it is a visualisation of information or of volume data. Finding suitable parameter values can take up most of the time in the visualisation process and users have to sensibly adjust a large number of parameters. Finding a useful parameter value distribution for achieving the desired visualisation result can be a cumbersome process which also depends on the user’s speed and experience. The purpose of this master’s thesis is to find a new and faster way to reach an appropriate parameter value distribution resulting in the desired visualisation.For this master’s thesis a prototype is developed which guides the user through a semi-automatic process of adjusting parameter values, which finally results in the desired visualisation of a scientific volume. Using this prototype enables the users to explore a large number of different parameter values within only a few iterations steps and a short amount of time. In order to do so we move away from the classic approach of setting parameters by adjusting sliders or combo boxes.
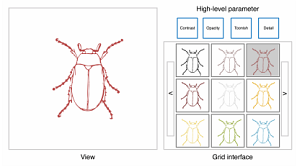
The idea of this thesis is to combine concepts that were already used in volume visualisation into a prototype. Our main strategy is to present pre-rendered images of the volume with different parameter values to the users. The images that are closest to the target visualisation can be selected and new images, similar to these, are shown. After some iterations of this process the users should have reached a visualisation that meets their expectations. The basis of our approach is a spreadsheet user interface.
Further we make use of the concept of high-level parameters, which are a combination of lowlevel parameters, like the specular exponent, to one single parameter, like contrast. The advantage of this concept is to have parameters which are more understandable to the users. We move away from the concept of displaying every single image in the spreadsheet interface, having multiple pages. Instead we use kMeans++ or DBScan with an automatic method to choose the distance parameter ? to cluster the images by similarity. This results in only the cluster centres, which are images, being presented to the user in the spreadsheet interface for exploration. Additionally, Locally Linear Embedding (LLE) is used to map single images into a global coordinate system. As a second new approach we use the distance between the images within the coordinate system as a similarity measure for kMeans++ and DBScan. To provide a fast calculation of the Locally Linear Embedding, which includes the nearest neighbours, the distance matrix and the Eigenvalues of the images, we use CUDA. The selection process consists of two different steps: exploration and refinement. Depending on the cluster size of the selected image, a re-clustering of the sub cluster is done if the user has reached the end of the cluster due to having explored all images and not achieving the desired final image. Thus a new set with varied parameter values is created and used to render new images. In contrast to the initially created set, the newly created one takes into account the explored parameter values from the images chosen by the user. This means that the range - in which the values of the single parameters are varied - is limited by the minimum and maximum value the parameter received during the before made exploration. Our tests showed that that by combining all these techniques it is possible to explore many different parameter values for high-level parameters in a very short time, and to achieve visualisations equal to those created by setting parameter values manually. In a short test our approach enabled two users, who are rather inexperienced in the field of volume visualisation, to create similar visualisations in fewer steps than by setting parameter values manually.
Additional Files and Images


Weblinks
No further information available.BibTeX
@mastersthesis{Hochmayr_Manuel_2015_PSE,
  title =      "Parameter Settings Exploration in Visualisation by Using a
               Semi-automatic Process",
  author =     "Manuel Hochmayr",
  year =       "2015",
  abstract =   "Parameters and the process of setting them play a major role
               in the world of computer based visualisation, no matter
               whether it is a visualisation of information or of volume
               data.  Finding suitable parameter values can take up most of
               the time in the visualisation process and users have to
               sensibly adjust a large number of parameters. Finding a
               useful parameter value distribution for achieving the
               desired visualisation result can be a cumbersome process
               which also depends on the user’s speed and experience. The
               purpose of this master’s thesis is to find a new and
               faster way to reach an appropriate parameter value
               distribution resulting in the desired visualisation.  For
               this master’s thesis a prototype is developed which guides
               the user through a semi-automatic process of adjusting
               parameter values, which finally results in the desired
               visualisation of a scientific volume. Using this prototype
               enables the users to explore a large number of different
               parameter values within only a few iterations steps and a
               short amount of time. In order to do so we move away from
               the classic approach of setting parameters by adjusting
               sliders or combo boxes.  The idea of this thesis is to
               combine concepts that were already used in volume
               visualisation into a prototype. Our main strategy is to
               present  pre-rendered images of the volume with different
               parameter values to the users. The images that are closest
               to the target visualisation can be selected and new images,
               similar to these, are shown. After some iterations of this
               process the users should have reached a visualisation that
               meets their expectations. The basis of our approach is a
               spreadsheet user interface.  Further we make use of the
               concept of high-level parameters, which are a combination of
               lowlevel parameters, like the specular exponent, to one
               single parameter, like contrast. The advantage of this
               concept is to have parameters which are more understandable
               to the users. We move away from the concept of displaying
               every single image in the spreadsheet interface, having
               multiple pages. Instead we use kMeans++ or DBScan with an
               automatic method to choose the distance parameter ? to
               cluster the images by similarity. This results in only the
               cluster centres, which are images, being presented to the
               user in the spreadsheet interface for exploration.
               Additionally, Locally Linear Embedding (LLE) is used to map
               single images into a global coordinate system. As a second
               new approach we use the distance between the images within
               the coordinate system as a similarity measure for kMeans++
               and DBScan. To provide a fast calculation of the Locally
               Linear Embedding, which includes the nearest neighbours, the
               distance matrix and the Eigenvalues of the images, we use
               CUDA. The selection process consists of two different steps:
               exploration and refinement. Depending on the cluster size of
               the selected image, a re-clustering of the sub cluster is
               done if the user has reached the end of the cluster due to
               having explored all images and not achieving the desired
               final image. Thus a new set with varied parameter values is
               created and used to render new images. In contrast to the
               initially created set, the newly created one takes into
               account the explored parameter values from the images chosen
               by the user. This means that the range - in which the values
               of the single parameters are varied - is limited by the
               minimum and maximum value the parameter received during the
               before made exploration. Our tests showed that that by
               combining all these techniques it is possible to explore
               many different parameter values for high-level parameters in
               a very short time, and to achieve visualisations equal to
               those created by setting parameter values manually. In a
               short test our approach enabled two users, who are rather
               inexperienced in the field of volume visualisation, to
               create similar visualisations in fewer steps than by setting
               parameter values manually.",
  month =      may,
  address =    "Favoritenstrasse 9-11/E193-02, A-1040 Vienna, Austria",
  school =     "Institute of Computer Graphics and Algorithms, Vienna
               University of Technology ",
  URL =        "https://www.cg.tuwien.ac.at/research/publications/2015/Hochmayr_Manuel_2015_PSE/",
}