

Johanna Schmidt , Bernhard Fröhler, Reinhold Preiner, Johannes Kehrer, Eduard Gröller, Stefan Bruckner, Christoph Heinzl
Visual Analysis of Volume Ensembles Based on Local Features
TR-186-2-16-2, May 2016
Information
- Publication Type: Technical Report
- Workgroup(s)/Project(s):
- Date: May 2016
- Number: TR-186-2-16-2
- Keywords: ensemble visualization, guided local exploration, variance analysis
Abstract
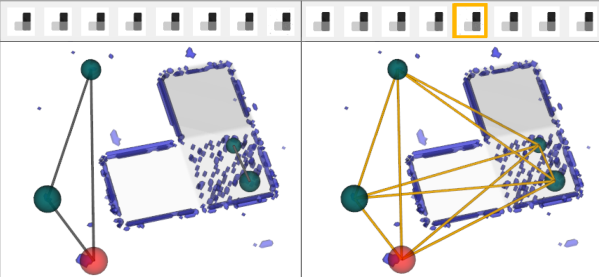
Ensemble datasets describe a specific phenomenon (e.g., a simulation scenario or a measurements series) through a large set of individual ensemble members. These individual members typically do not differ too much from each other but rather feature slightly changing characteristics. In many cases, the ensemble members are defined in 3D space, which implies severe challenges when exploring the complete ensembles such as handling occlusions, focus and context or its sheer datasize. In this paper we address these challenges and put our focus on the exploration of local features in 3D volumetric ensemble datasets, not only by visualizing local characteristics, but also by identifying connections to other local features with similar characteristics in the data. We evaluate the variance in the dataset and use the the spatial median (medoid) of the ensemble to visualize the differences in the dataset. This medoid is subsequently used as a representative of the ensemble in 3D. The variance information is used to guide users during the exploration, as regions of high variance also indicate larger changes within the ensemble members. The local characteristics of the regions can be explored by using our proposed 3D probing widgets. These widgets consist of a 3D sphere, which can be positioned at any point in 3D space. While moving a widget, the local data characteristics at the corresponding position are shown in a separate detail view, which depicts the local outliers and their surfaces in comparison to the medoid surface. The 3D probing widgets can also be fixed at a user-defined position of interest. The fixed probing widgets are arranged in a similarity graph to indicate similar local data characteristics. The similarity graph thus allows to explore whether high variances in a certain region are caused by the same dataset members or not. Finally, it is also possible to compare a single member against the rest of the ensemble. We evaluate our technique through two demonstration cases using volumetric multi-label segmentation mask datasets, two from the industrial domain and two from the medical domain.Additional Files and Images

Weblinks
No further information available.BibTeX
@techreport{TR1862162,
  title =      "Visual Analysis of Volume Ensembles Based on Local Features",
  author =     "Johanna Schmidt and Bernhard Fr\"{o}hler and Reinhold
               Preiner and Johannes Kehrer and Eduard Gr\"{o}ller and
               Stefan Bruckner and Christoph Heinzl",
  year =       "2016",
  abstract =   "Ensemble datasets describe a specific phenomenon (e.g., a
               simulation scenario or a measurements series) through a
               large set of individual ensemble members. These individual
               members typically do not differ too much from each other but
               rather feature slightly changing characteristics. In many
               cases, the ensemble members are defined in 3D space, which
               implies severe challenges when exploring the complete
               ensembles such as handling occlusions, focus and context or
               its sheer datasize. In this paper we address these
               challenges and put our focus on the exploration of local
               features in 3D volumetric ensemble datasets, not only by
               visualizing local characteristics, but also by identifying
               connections to other local features with similar
               characteristics in the data. We evaluate the variance in the
               dataset and use the the spatial median (medoid) of the
               ensemble to visualize the differences in the dataset. This
               medoid is subsequently used as a representative of the
               ensemble in 3D. The variance information is used to guide
               users during the exploration, as regions of high variance
               also indicate larger changes within the ensemble members.
               The local characteristics of the regions can be explored by
               using our proposed 3D probing widgets. These widgets consist
               of a 3D sphere, which can be positioned at any point in 3D
               space. While moving a widget, the local data characteristics
               at the corresponding position are shown in a separate detail
               view, which depicts the local outliers and their surfaces in
               comparison to the medoid surface. The 3D probing widgets can
               also be fixed at a user-defined position of interest. The
               fixed probing widgets are arranged in a similarity graph to
               indicate similar local data characteristics. The similarity
               graph thus allows to explore whether high variances in a
               certain region are caused by the same dataset members or
               not. Finally, it is also possible to compare a single member
               against the rest of the ensemble. We evaluate our technique
               through two demonstration cases using volumetric multi-label
               segmentation mask datasets, two from the industrial domain
               and two from the medical domain.",
  month =      may,
  number =     "TR-186-2-16-2",
  address =    "Favoritenstrasse 9-11/E193-02, A-1040 Vienna, Austria",
  institution = "Institute of Computer Graphics and Algorithms, Vienna
               University of Technology ",
  note =       "human contact: technical-report@cg.tuwien.ac.at",
  keywords =   "ensemble visualization, guided local exploration, variance
               analysis",
  URL =        "https://www.cg.tuwien.ac.at/research/publications/2016/TR1862162/",
}