Information
- Publication Type: Bachelor Thesis
- Workgroup(s)/Project(s):
- Date: 2017
- Date (Start): May 2016
- Date (End): March 2017
- Matrikelnummer: 0123456
- First Supervisor: Manuela Waldner
Abstract
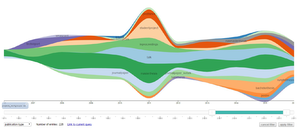
The publication database of the Institute of Computer Graphics and Algorithms can currently be queried by a simple UI which returns a list. Stream I/O, the application of this thesis, extends the interface to improve it in terms of overview, exploration and analysis support. To cope with these shortcommings a visualization is added to the user interface. As the publication database includes a lot of additional data attributes, a selection of attributes is used for the visualization to give further insight. By using the Streamgraph [BW08] visualization, the variations over time within attributes like authors, publication type and research areas are made visible. The focus of this visualization lies in showing individual attribute values while also conveying the sum. This relationship is depicted in a timeline, which allows a user to explore the past and current work of the institute as well as to find relationships and trends in the publications. As the visualization uses a timeline encoding, the directed flow from left to right is interpreted as the movement through time. It shows the evolution of different attributes, while the occurrence of a topic at a specific time is coded with the width of the layer at a specific point. Searching the database is enriched through multiple viewpoints which give the user insight how attributes relate in the underlying data and how the data is changing through his/her manipulation. Selections of colored layers within the graph can represent bigger trends and give insight into the data as a whole. The Stream I/O application invites users to interactively explore the publication database, while simultaneously gaining new insight through the visualization.Additional Files and Images
Weblinks
No further information available.BibTeX
@bachelorsthesis{mazurek-2017-sio,
  title =      "Stream I/O - An Interactive Visualization of Publication
               Data",
  author =     "Michael Mazurek",
  year =       "2017",
  abstract =   "The publication database of the Institute of Computer
               Graphics and Algorithms can currently be queried by a simple
               UI which returns a list. Stream I/O, the application of this
               thesis, extends the interface to improve it in terms of
               overview, exploration and analysis support. To cope with
               these shortcommings a visualization is added to the user
               interface. As the publication database includes a lot of
               additional data attributes, a selection of attributes is
               used for the visualization to give further insight. By using
               the Streamgraph [BW08] visualization, the variations over
               time within attributes like authors, publication type and
               research areas are made visible. The focus of this
               visualization lies in showing individual attribute values
               while also conveying the sum. This relationship is depicted
               in a timeline, which allows a user to explore the past and
               current work of the institute as well as to find
               relationships and trends in the publications. As the
               visualization uses a timeline encoding, the directed flow
               from left to right is interpreted as the movement through
               time. It shows the evolution of different attributes, while
               the occurrence of a topic at a specific time is coded with
               the width of the layer at a specific point. Searching the
               database is enriched through multiple viewpoints which give
               the user insight how attributes relate in the underlying
               data and how the data is changing through his/her
               manipulation. Selections of colored layers within the graph
               can represent bigger trends and give insight into the data
               as a whole. The Stream I/O application invites users to
               interactively explore the publication database, while
               simultaneously gaining new insight through the
               visualization.",
  address =    "Favoritenstrasse 9-11/E193-02, A-1040 Vienna, Austria",
  school =     "Institute of Computer Graphics and Algorithms, Vienna
               University of Technology ",
  URL =        "https://www.cg.tuwien.ac.at/research/publications/2017/mazurek-2017-sio/",
}


