

Johannes Sorger
Integration Strategies in the Visualization of Multifaceted Spatial Data
Supervisor: Ivan Viola
Duration: 2013 — 2017
[ thesis]
Information
- Publication Type: PhD-Thesis
- Workgroup(s)/Project(s):
- Date: September 2017
- Date (Start): 2013
- Date (End): 2017
- TU Wien Library:
- Second Supervisor: Eduard Gröller
- 1st Reviewer: Torsten Möller
- 2nd Reviewer: Barbora Kozlikova
- Rigorosum: 22. November 2017
- First Supervisor: Ivan Viola
Abstract
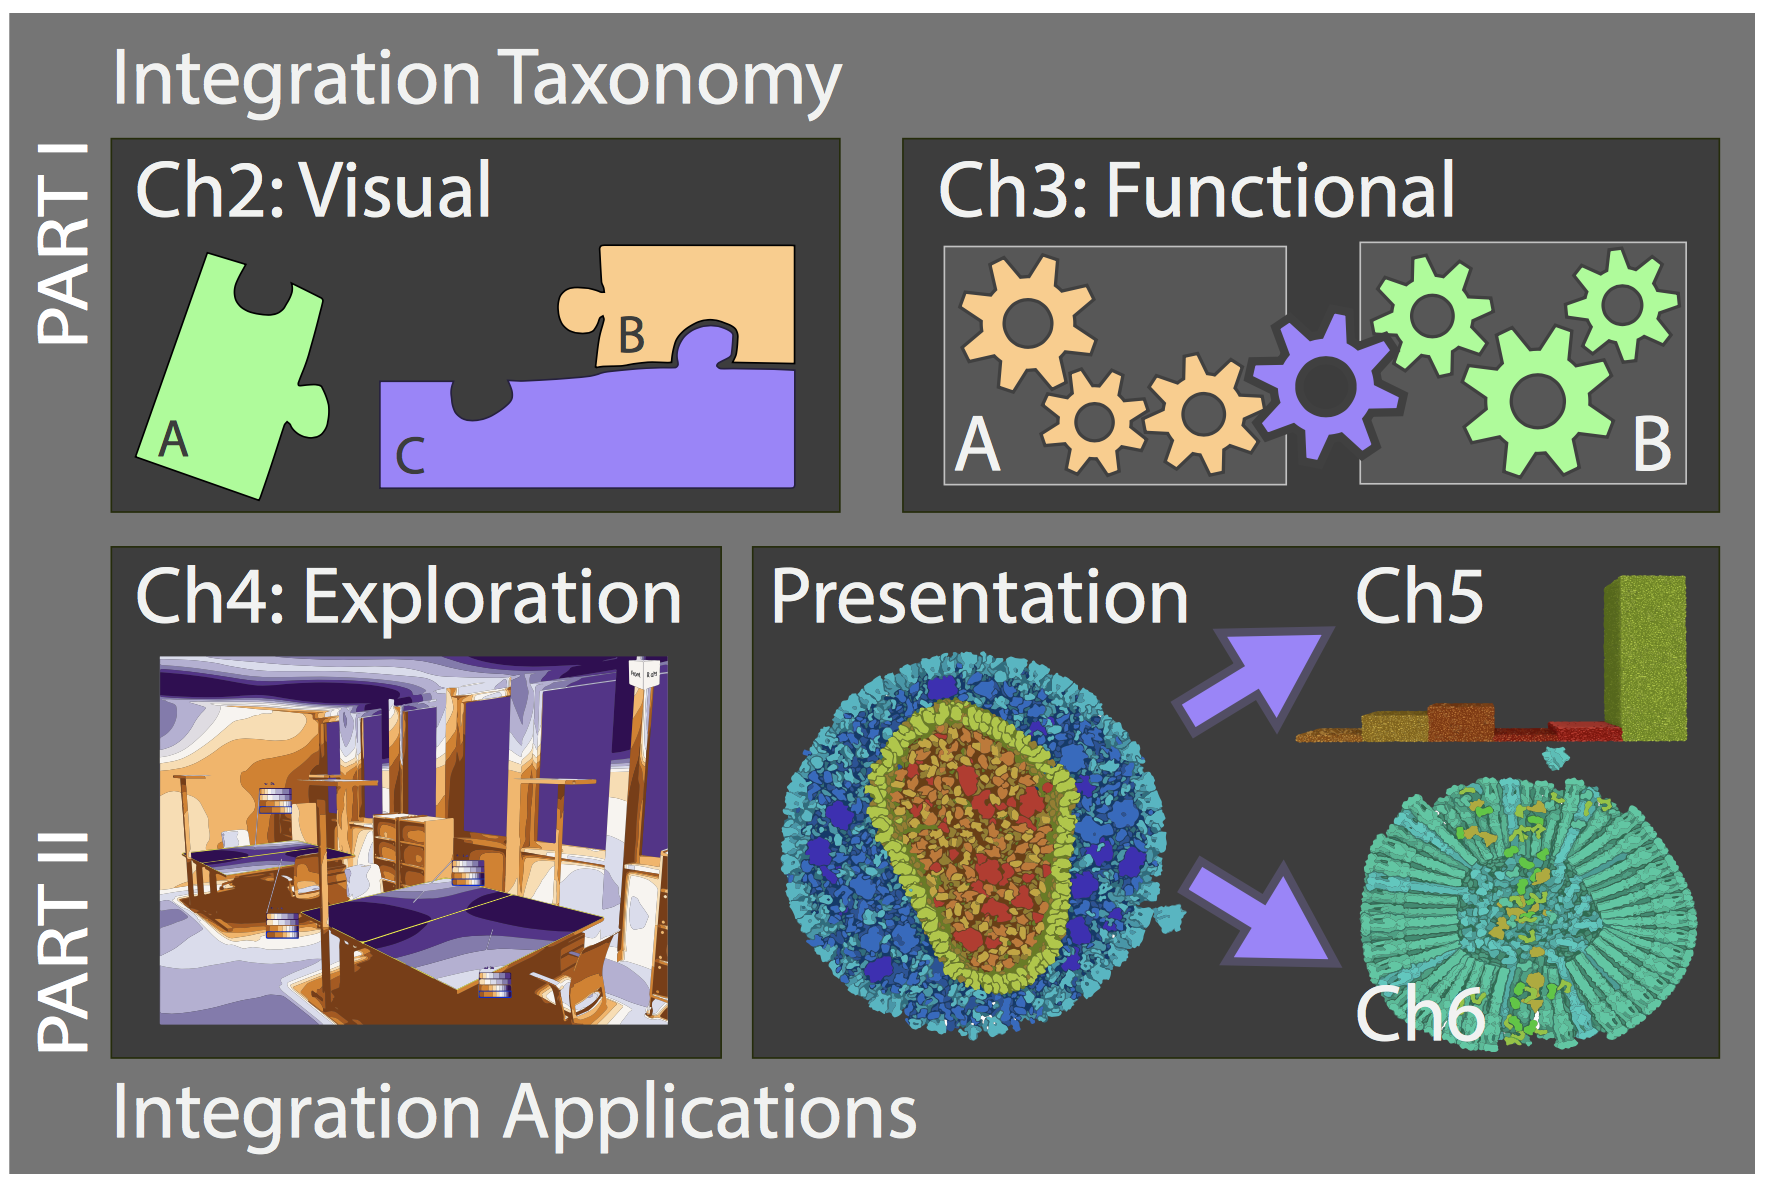
Visualization designers have several visual channels at their disposal for encoding data into visual representations, e.g., position, size, shape, orientation, color, texture, brightness, as well as motion. The mapping of attributes to visual channels can be chosen by the designer. In theory, any data attribute can be represented by any of these visual channels or by a combination of multiple of these channels. In practice, the optimal mapping and the most suitable type of visualization strongly depend on the data as well as on the user's task. In the visualization of spatial data, the mapping of spatial attributes to visual channels is inherently given by the data. Multifaceted spatial data possesses a wide range of additional (non-spatial) attributes without a given mapping. The data's given spatial context is often important for successfully fulfilling a task. The design space in spatial data visualization can therefore be heavily constrained when trying to choose an optimal mapping for other attributes within the spatial context. To solve an exploration or presentation task in the domain of multifaceted spatial data, special strategies have to be employed in order to integrate the essential information from the various data facets in an appropriate representation form with the spatial context. This thesis explores visualization integration strategies for multifaceted spatial data. The first part of this thesis describes the design space of integration in terms of two aspects: visual and functional integration. Visual integration describes how representations of the different data facets can be visually composed within a spatial context. Functional integration, describes how events that have been triggered, for instance, through user interaction, can be coordinated across the various visually integrated representations. The second part of this thesis describes contributions to the field of visualization in the context of concrete integration applications for exploration and presentation scenarios. The first scenario addresses a set of challenges in the exploratory analysis of multifaceted spatial data in the scope of a decision making scenario in lighting design. The user's task is to find an optimal lighting solution among dozens or even hundreds of potential candidates. In the scope of a design study, the challenges in lighting design are addressed with LiteVis, a system that integrates representations of the simulation parameter space with representations of all relevant aspects of the simulation output. The integration of these heterogeneous aspects together with a novel ranking visualization are thereby the key to enabling an efficient exploration and comparison of lighting parametrizations. In presentation scenarios, the generation of insights often cannot rely on user interaction and therefore needs a different approach. The challenge is to generate visually appealing, yet information-rich representations for mainly passive observation. In this context, this thesis addresses two different challenges in the domain of molecular visualization. The first challenge concerns the conveying of relations between two different representations of a molecular data set, such as a virus. The relation is established via animated transitions - a temporal form of integration between two representations. The proposed solution features a novel technique for creating such transitions that are re-usable for different data sets, and can be combined in a modular fashion. Another challenge in presentation scenarios of multifaceted spatial data concerns the presentation of the transition between development states of molecular models, where the actual biochemical process of the transition is not exactly known or it is too complex to represent. A novel technique applies a continuous abstraction of both model representations to a level of detail at which the relationship between them can be accurately conveyed, in order to overcome a potential indication of false relationship information. Integration thereby brings the different abstraction levels and the different model states into relation with each other. The results of this thesis clearly demonstrate that integration is a versatile tool in overcoming key challenges in the visualization of multifaceted spatial data.Additional Files and Images

Weblinks
No further information available.BibTeX
@phdthesis{sorger-2017-thesis,
  title =      "Integration Strategies in the Visualization of Multifaceted
               Spatial Data",
  author =     "Johannes Sorger",
  year =       "2017",
  abstract =   "Visualization designers have several visual channels at
               their disposal for encoding data into visual
               representations, e.g., position, size, shape, orientation,
               color, texture, brightness, as well as motion. The mapping
               of attributes to visual channels can be chosen by the
               designer. In theory, any data attribute can be represented
               by any of these visual channels or by a combination of
               multiple of these channels. In practice, the optimal mapping
               and the most suitable type of visualization strongly depend
               on the data as well as on the user's task. In the
               visualization of spatial data, the mapping of spatial
               attributes to visual channels is inherently given by the
               data. Multifaceted spatial data possesses a wide range of
               additional (non-spatial) attributes without a given mapping.
               The data's given spatial context is often important for
               successfully fulfilling a task. The design space in spatial
               data visualization can therefore be heavily constrained when
               trying to choose an optimal mapping for other attributes
               within the spatial context. To solve an exploration or
               presentation task in the domain of multifaceted spatial
               data, special strategies have to be employed in order to
               integrate the essential information from the various data
               facets in an appropriate representation form with the
               spatial context. This thesis explores visualization
               integration strategies for multifaceted spatial data. The
               first part of this thesis describes the design space of
               integration in terms of two aspects: visual and functional
               integration. Visual integration describes how
               representations of the different data facets can be visually
               composed within a spatial context. Functional integration,
               describes how events that have been triggered, for instance,
               through user interaction, can be coordinated across the
               various visually integrated representations. The second part
               of this thesis describes contributions to the field of
               visualization in the context of concrete integration
               applications for exploration and presentation scenarios. The
               first scenario addresses a set of challenges in the
               exploratory analysis of multifaceted spatial data in the
               scope of a decision making scenario in lighting design. The
               user's task is to find an optimal lighting solution among
               dozens or even hundreds of potential candidates. In the
               scope of a design study, the challenges in lighting design
               are addressed with LiteVis, a system that integrates
               representations of the simulation parameter space with
               representations of all relevant aspects of the simulation
               output. The integration of these heterogeneous aspects
               together with a novel ranking visualization are thereby the
               key to enabling an efficient exploration and comparison of
               lighting parametrizations. In presentation scenarios, the
               generation of insights often cannot rely on user interaction
               and therefore needs a different approach. The challenge is
               to generate visually appealing, yet information-rich
               representations for mainly passive observation. In this
               context, this thesis addresses two different challenges in
               the domain of molecular visualization. The first challenge
               concerns the conveying of relations between two different
               representations of a molecular data set, such as a virus.
               The relation is established via animated transitions - a
               temporal form of integration between two representations.
               The proposed solution features a novel technique for
               creating such transitions that are re-usable for different
               data sets, and can be combined in a modular fashion.
               Another challenge in presentation scenarios of multifaceted
               spatial data concerns the presentation of the transition
               between development states of molecular models, where the
               actual biochemical process of the transition is not exactly
               known or it is too complex to represent. A novel technique
               applies a continuous abstraction of both model
               representations to a level of detail at which the
               relationship between them can be accurately conveyed, in
               order to overcome a potential indication of false
               relationship information. Integration thereby brings the
               different abstraction levels and the different model states
               into relation with each other. The results of this thesis
               clearly demonstrate that integration is a versatile tool in
               overcoming key challenges in the visualization of
               multifaceted spatial data. ",
  month =      sep,
  address =    "Favoritenstrasse 9-11/E193-02, A-1040 Vienna, Austria",
  school =     "Institute of Computer Graphics and Algorithms, Vienna
               University of Technology ",
  URL =        "https://www.cg.tuwien.ac.at/research/publications/2017/sorger-2017-thesis/",
}