

Nikolaus Karall
Comparative Visual Analytics in a Cohort of Breast Cancer Patients
[image] [ Master Thesis]
Information
- Publication Type: Master Thesis
- Workgroup(s)/Project(s):
- Date: May 2018
- Date (Start): 1. August 2017
- Date (End): 25. May 2018
- TU Wien Library:
- First Supervisor:
- Keywords: comparative visual analytics, breast cancer

Abstract
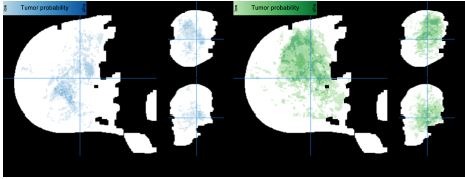
The most common cancer among the female population in the economically developed world is breast cancer. To significantly reduce the mortality among affected women, an early diagnosis is essential, and also treatment strategies need to be selected carefully. Clinical researchers working on the selection of chemotherapy treatment need to analyze the progress of the disease during and after treatment and to understand how different groups of patients respond to selected treatments. Currently this is a difficult task because of the multitude of involved (imaging and non-imaging) data, for which adequate visualizations are required. The aim of this work is to help clinical researchers working on the analysis of the progress of chemotherapy to understand and explore the multitude of data they have. This thesis introduces a web-based framework realizing three tasks of exploring and analyzing imaging and non-imaging data of breast cancer patients in a cohort. A functionality for single patient follow-up studies (intra-patient study), a functionality to compare two different patients (pairwise inter-patient study) and a functionality to compare groups of patients (groupwise inter-patient study) are provided to enable an easier exploration and analysis of the available multivariate cohort data. To begin with, the imaging and non-imaging data underwent some preprocessing steps, such as registration, segmentation and calculation of tumor probability maps, to make them comparable. Afterwards, we carefully designed and implemented several multiple linked views, where interactive representations show distinct aspects of the data from which the clinical researcher can understand and analyze the available cohort data. A number of use cases to demonstrate the results that can be achieved with the provided framework are performed and they illustrate the functionality and also the importance of the designed and implemented visual analytics framework. Using this framework, clinical researchers are able to visually explore and analyze the multitude of both imaging and non-imaging data of a patient and compare patients within a cohort, which was not possible before with any available exploratory tools.Additional Files and Images

Weblinks
BibTeX
@mastersthesis{Karall2017CVAB,
  title =      "Comparative Visual Analytics in a Cohort of Breast Cancer
               Patients",
  author =     "Nikolaus Karall",
  year =       "2018",
  abstract =   "The most common cancer among the female population in the
               economically developed world is breast cancer. To
               significantly reduce the mortality among affected women, an
               early diagnosis is essential, and also treatment strategies
               need to be selected carefully. Clinical researchers working
               on the selection of chemotherapy treatment need to analyze
               the progress of the disease during and after treatment and
               to understand how different groups of patients respond to
               selected treatments. Currently this is a difficult task
               because of the multitude of involved (imaging and
               non-imaging) data, for which adequate visualizations are
               required. The aim of this work is to help clinical
               researchers working on the analysis of the progress of
               chemotherapy to understand and explore the multitude of data
               they have. This thesis introduces a web-based framework
               realizing three tasks of exploring and analyzing imaging and
               non-imaging data of breast cancer patients in a cohort. A
               functionality for single patient follow-up studies
               (intra-patient study), a functionality to compare two
               different patients (pairwise inter-patient study) and a
               functionality to compare groups of patients (groupwise
               inter-patient study) are provided to enable an easier
               exploration and analysis of the available multivariate
               cohort data. To begin with, the imaging and non-imaging data
               underwent some preprocessing steps, such as registration,
               segmentation and calculation of tumor probability maps, to
               make them comparable. Afterwards, we carefully designed and
               implemented several multiple linked views, where interactive
               representations show distinct aspects of the data from which
               the clinical researcher can understand and analyze the
               available cohort data. A number of use cases to demonstrate
               the results that can be achieved with the provided framework
               are performed and they illustrate the functionality and also
               the importance of the designed and implemented visual
               analytics framework. Using this framework, clinical
               researchers are able to visually explore and analyze the
               multitude of both imaging and non-imaging data of a patient
               and compare patients within a cohort, which was not possible
               before with any available exploratory tools.",
  month =      may,
  address =    "Favoritenstrasse 9-11/E193-02, A-1040 Vienna, Austria",
  school =     "Institute of Computer Graphics and Algorithms, Vienna
               University of Technology ",
  keywords =   "comparative visual analytics, breast cancer",
  URL =        "https://www.cg.tuwien.ac.at/research/publications/2018/Karall2017CVAB/",
}