

Hsiang-Yun Wu , Martin Nöllenburg, Ivan Viola
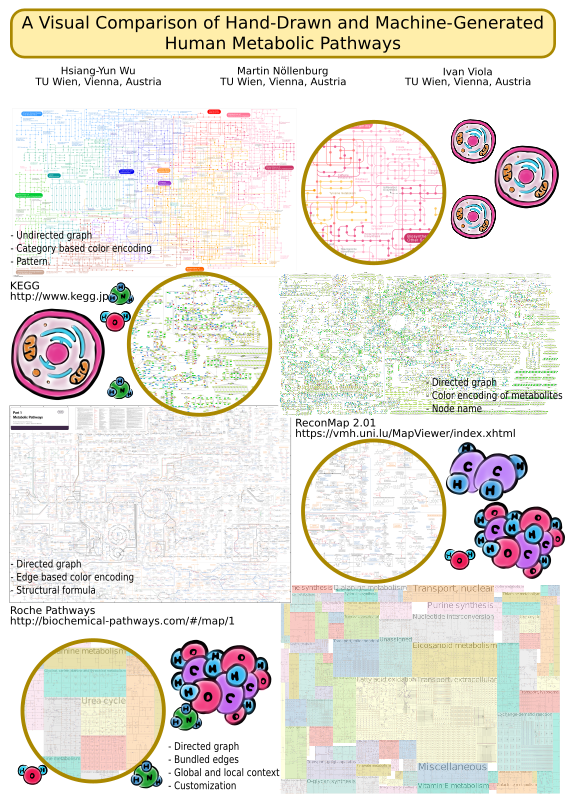
A Visual Comparison of Hand-Drawn and Machine-Generated Human Metabolic Pathways
Poster shown at EuroVis
( 4. June 2018- 8. June 2018)
[ poster]
Information
- Publication Type: Poster
- Workgroup(s)/Project(s):
- Date: June 2018
- Event: EuroVis
- Call for Papers: Call for Paper
- Conference date: 4. June 2018 – 8. June 2018
Abstract
This poster abstract presents a visual comparison between three hand-drawn and one machine-generated human metabolic pathway diagrams. The human metabolic pathways, which describe significant biochemical reactions in the human body, have been increasingly investigated due to the development of analysis processes and are compiled into pathway diagrams to provide an overview of reaction in the human body. This complex network includes about 5,000 metabolites and 7,500 reactions, which are hierarchically nested and difficult to visualize. We collect and analyze well-known human metabolic pathway diagrams, and summarize the design choices of these diagrams, respectively. Together with a machine-generated diagram, we can understand the visual complexity of three hand-drawn and one machine-generated diagrams.Additional Files and Images

Weblinks
No further information available.BibTeX
@misc{wu-2018-metabo,
  title =      "A Visual Comparison of Hand-Drawn and Machine-Generated
               Human Metabolic Pathways",
  author =     "Hsiang-Yun Wu and Martin N\"{o}llenburg and Ivan Viola",
  year =       "2018",
  abstract =   "This poster abstract presents a visual comparison between
               three hand-drawn and one machine-generated human metabolic
               pathway diagrams. The human metabolic pathways, which
               describe significant biochemical reactions in the human
               body, have been increasingly investigated due to the
               development of analysis processes and are compiled into
               pathway diagrams to provide an overview of reaction in the
               human body. This complex network includes about 5,000
               metabolites and 7,500 reactions, which are hierarchically
               nested and difficult to visualize. We collect and analyze
               well-known human metabolic pathway diagrams, and summarize
               the design choices of these diagrams, respectively. Together
               with a machine-generated diagram, we can understand the
               visual complexity of three hand-drawn and one
               machine-generated diagrams. ",
  month =      jun,
  event =      "EuroVis",
  Conference date = "Poster presented at EuroVis (2018-06-04--2018-06-08)",
  URL =        "https://www.cg.tuwien.ac.at/research/publications/2018/wu-2018-metabo/",
}