Information
- Publication Type: Bachelor Thesis
- Workgroup(s)/Project(s):
- Date: August 2019
- Date (Start): 15. January 2019
- Date (End): 15. August 2019
- Matrikelnummer: 01325827
- First Supervisor: Eduard Gröller
Abstract
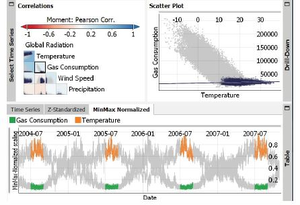
Recent evaluation indicates that wrong decisions resulting from systems operating based on bad data costed worldwide about $30 billion in the year 2006. This work addresses the importance of Data Quality (DQ) as a critical requirement in any information system. In this regard, DQ criteria and problems such as missing entries, duplicates, and faulty values are identified. Different approaches and techniques used for data cleaning to fix DQ issues are reviewed. In this work a new technique is integrated into VISPLORE, a framework for data analysis and visualization, that allows the framework to visualize multiple types of per-value meta-information. We will show how our work enhances the readability of the table lens view, one of the many viewing modes provided in VISPLORE, and helps the user understand the status of data entries to decide on what entries need to be cleaned and how. This work also expands on the interactive data cleaning tools provided by VISPLORE, by allowing the user to manually delete implausible values or replace them with more plausible ones, while keeping track of this cleaning process. With the integrated new features to the table lens view, VISPLORE is now able to present more detailed data with enhanced visualization features and interactive data cleaning.Additional Files and Images
Weblinks
No further information available.BibTeX
@bachelorsthesis{Hainoun2019,
  title =      "Visualization of Data Flags in Table Lens Views to Improve
               the Readability of Metadata and the Tracking of Data
               Cleaning",
  author =     "Muhammad Mujahed Hainoun",
  year =       "2019",
  abstract =   "Recent evaluation indicates that wrong decisions resulting
               from systems operating based on bad data costed worldwide
               about $30 billion in the year 2006. This work addresses the
               importance of Data Quality (DQ) as a critical requirement in
               any information system. In this regard, DQ criteria and
               problems such as missing entries, duplicates, and faulty
               values are identified. Different approaches and techniques
               used for data cleaning to fix DQ issues are reviewed. In
               this work a new technique is integrated into VISPLORE, a
               framework for data analysis and visualization, that allows
               the framework to visualize multiple types of per-value
               meta-information. We will show how our work enhances the
               readability of the table lens view, one of the many viewing
               modes provided in VISPLORE, and helps the user understand
               the status of data entries to decide on what entries need to
               be cleaned and how. This work also expands on the
               interactive data cleaning tools provided by VISPLORE, by
               allowing the user to manually delete implausible values or
               replace them with more plausible ones, while keeping track
               of this cleaning process. With the integrated new features
               to the table lens view, VISPLORE is now able to present more
               detailed data with enhanced visualization features and
               interactive data cleaning.",
  month =      aug,
  address =    "Favoritenstrasse 9-11/E193-02, A-1040 Vienna, Austria",
  school =     "Research Unit of Computer Graphics, Institute of Visual
               Computing and Human-Centered Technology, Faculty of
               Informatics, TU Wien ",
  URL =        "https://www.cg.tuwien.ac.at/research/publications/2019/Hainoun2019/",
}

 Bachelor Thesis
 image
image

