

 Bachelor Thesis
Information
- Publication Type: Bachelor Thesis
- Workgroup(s)/Project(s):
- Date: May 2019
- Date (Start): 2. November 2018
- Date (End): 29. May 2019
- Matrikelnummer: 01525071
- First Supervisor: Eduard Gröller

Abstract
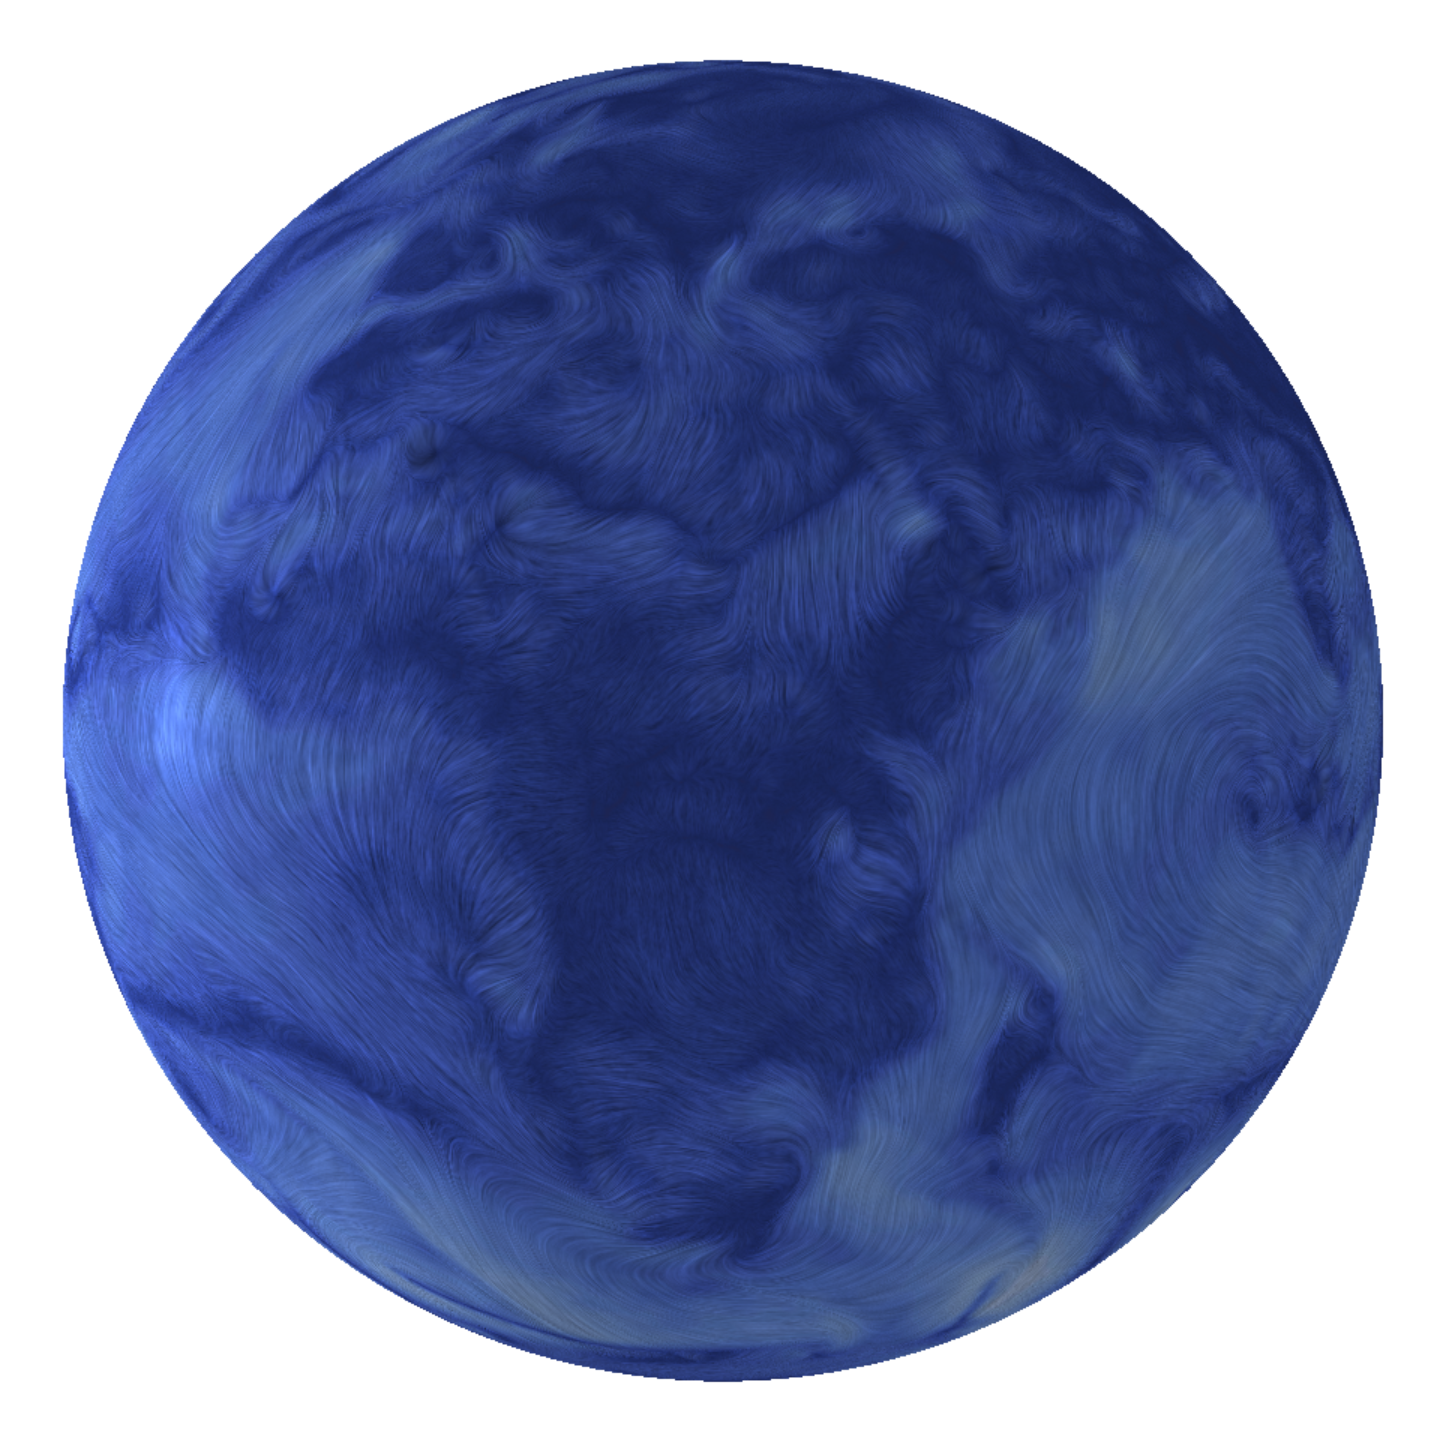
Climate researchers often use simulations to generate 2D vector fields of wind or ocean currents. They need visualization tools to validate and further improve their research. In this work, we present a framework that is capable of visualizing unsteady 2D flow fields on curved surfaces. An important property of our framework is that it works intrinsically in 2D, instead of in 3D ambient space. Our primary example is the visualization of 2D geophysical flow on the 2-sphere. We build on methods from differential geometry to compute line integral convolution and path lines intrinsically on curved surfaces. While line integral convolution provides an overview of one time step of an unsteady flow field, path lines give us a more detailed insight into an unsteady flow field. We animate the line integral convolution images and the path lines to show the direction of the flow. Furthermore, we illuminate the path lines to improve spatial perception. Our visualizations are all computed in real time and can be used interactively.Additional Files and Images

Weblinks
- Youtube: Flow Visualization on Curved Manifolds
Flow Visualization on Curved Manifolds
BibTeX
@bachelorsthesis{Troidl_2019,
  title =      "Flow Visualization on Curved Manifolds",
  author =     "Jakob Troidl",
  year =       "2019",
  abstract =   "Climate researchers often use simulations to generate 2D
               vector fields of wind or ocean currents. They need
               visualization tools to validate and further improve their
               research. In this work, we present a framework that is
               capable of visualizing unsteady 2D flow fields on curved
               surfaces. An important property of our framework is that it
               works intrinsically in 2D, instead of in 3D ambient space.
               Our primary example is the visualization of 2D geophysical
               flow on the 2-sphere. We build on methods from differential
               geometry to compute line integral convolution and path lines
               intrinsically on curved surfaces. While line integral
               convolution provides an overview of one time step of an
               unsteady flow field, path lines give us a more detailed
               insight into an unsteady flow field. We animate the line
               integral convolution images and the path lines to show the
               direction of the flow. Furthermore, we illuminate the path
               lines to improve spatial perception. Our visualizations are
               all computed in real time and can be used interactively.",
  month =      may,
  address =    "Favoritenstrasse 9-11/E193-02, A-1040 Vienna, Austria",
  school =     "Research Unit of Computer Graphics, Institute of Visual
               Computing and Human-Centered Technology, Faculty of
               Informatics, TU Wien ",
  URL =        "https://www.cg.tuwien.ac.at/research/publications/2019/Troidl_2019/",
}