

Akari Iijima, Takayuki Itoh, Hsiang-Yun Wu , Nicolas Grossmann
Visualization of Semantic Differential Studies with a Large Number of Images, Participants and Attributes
In Proceedings of the 24th International Conference on Information Visualisation (iV2020), pages 1-6. September 2020.
[image] [ paper]
Information
- Publication Type: Conference Paper
- Workgroup(s)/Project(s):
- Date: September 2020
- Lecturer: Akari Iijima
- Event: The 24th International Conference on Information Visualisation (iV2020)
- Call for Papers: Call for Paper
- Booktitle: Proceedings of the 24th International Conference on Information Visualisation (iV2020)
- Pages: 1 – 6
Abstract
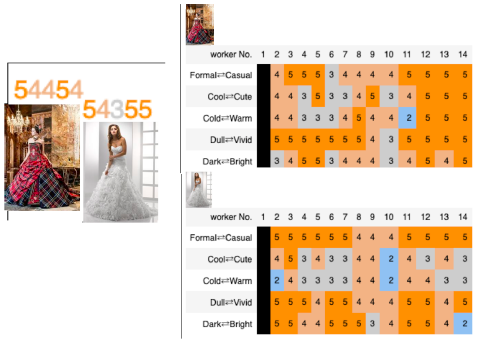
The Semantic Differential (SD) Method is a rating scale to measure the semantics. Attributes of SD are constructed by collecting the responses of participant’s impres- sions of the objects expressed through Likert scales representing multiple contrasting with some adjective pairs, for example, dark and bright, formal and casual, etc. Impression evaluation can be used as an index that reflects a human subjective feelings to some extent. Impression evaluations using the SD method consist of the responses of many participants, and therefore, the individual differences in the impressions of the participants greatly affect the content of the data. In this study, we propose a visualization system to analyze three aspects of SD, objects (images), participants, and attributes defined by adjective pairs. We visualize the impression evaluation data by applying dimension reduction so that, users can discover the trends and outliers of the data, such as images that are hard to judge or participants that act unpredictably. The system firstly visualizes the attributes or color distribution of the images by applying a dimensional reduction method to the impression or RGB values of each image. Then, our approach displays the average and median of each attribute near the images. This way, we can visualize the three aspects of objects, participants and attributes on a single screen and observe the relationships between image features and user impressions / attribute space. We introduce visualization examples of our system with the dataset inviting 21 participants who performed impression evaluations with 300 clothing images.Additional Files and Images

Weblinks
BibTeX
@inproceedings{Iijima-2020-iV,
  title =      "Visualization of Semantic Differential Studies with a Large
               Number of Images, Participants and Attributes",
  author =     "Akari Iijima and Takayuki Itoh and Hsiang-Yun Wu and Nicolas
               Grossmann",
  year =       "2020",
  abstract =   "The Semantic Differential (SD) Method is a rating scale to
               measure the semantics. Attributes of SD are constructed by
               collecting the responses of participant’s impres- sions of
               the objects expressed through Likert scales representing
               multiple contrasting with some adjective pairs, for example,
               dark and bright, formal and casual, etc. Impression
               evaluation can be used as an index that reflects a human
               subjective feelings to some extent. Impression evaluations
               using the SD method consist of the responses of many
               participants, and therefore, the individual differences in
               the impressions of the participants greatly affect the
               content of the data. In this study, we propose a
               visualization system to analyze three aspects of SD, objects
               (images), participants, and attributes defined by adjective
               pairs. We visualize the impression evaluation data by
               applying dimension reduction so that, users can discover the
               trends and outliers of the data, such as images that are
               hard to judge or participants that act unpredictably. The
               system firstly visualizes the attributes or color
               distribution of the images by applying a dimensional
               reduction method to the impression or RGB values of each
               image. Then, our approach displays the average and median of
               each attribute near the images. This way, we can visualize
               the three aspects of objects, participants and attributes on
               a single screen and observe the relationships between image
               features and user impressions / attribute space. We
               introduce visualization examples of our system with the
               dataset inviting 21 participants who performed impression
               evaluations with 300 clothing images.",
  month =      sep,
  event =      "The 24th International Conference on Information
               Visualisation (iV2020)",
  booktitle =  "Proceedings of the 24th International Conference on
               Information Visualisation (iV2020)",
  pages =      "1--6",
  URL =        "https://www.cg.tuwien.ac.at/research/publications/2020/Iijima-2020-iV/",
}