Information
- Publication Type: Master Thesis
- Workgroup(s)/Project(s):
- Date: August 2021
- Date (Start): 9. October 2019
- Date (End): 9. August 2021
- TU Wien Library:
- Diploma Examination: 9. August 2021
- Open Access: yes
- First Supervisor: Eduard Gröller

- Pages: 133
- Keywords: visual analytics, 2D-3D integration
Abstract
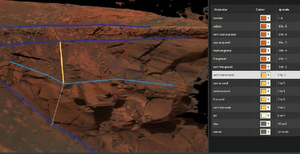
In recent years, digital outcrop models have become a popular tool to carry out geological investigations on the computer. These high-resolution, 3-dimensional models of outcrops are also created for the exploration of Mars. With specialized software, geologists can annotate geological attributes on digital outcrop models, such as the boundaries between di˙erent rock layers. After annotating, geologists create logs, a graphic description of the rock layers. To establish a geological model of a larger region, corresponding layers are correlated in multiple logs. The correlated layers of the logs are graphically linked in a correlation panel. Creating correlation panels is very time-consuming, and they are usually created by hand with drawing programs. Due to this restriction, the diagrams are created at the end of the interpretation process to avoid time-consuming editing afterwards. When switching to a drawing program, the connection between the original data and the encoded data in the diagram is also lost. This work is part of a design study with the aim of automating the creation of correlation panels, and turning a static illustration into an interactive application that can be integrated into the interpretation process. In this work, after a short introduction to the exploration of Mars with the help of geology, we analyse published correlation panels to explore the design space of these illustrations. In addition to that analysis we conducted workshops and a research stay at Imperial College London with our domain collaborators. Using the information gained from the analysis and our collaborators, we describe possible design choices, and extract the minimum requirements for a prototype. The prototype created in the course of this work was later extended and presented in a paper that encompasses the whole design study.
Additional Files and Images
Additional images and videos
Additional files
Weblinks
BibTeX
@mastersthesis{Nowak_2021,
  title =      "Interactive Correlation Panels for the Geological Mapping of
               the Martian Surface",
  author =     "Rebecca Nowak",
  year =       "2021",
  abstract =   "In recent years, digital outcrop models have become a
               popular tool to carry out geological investigations on the
               computer. These high-resolution, 3-dimensional models of
               outcrops are also created for the exploration of Mars. With
               specialized software, geologists can annotate geological
               attributes on digital outcrop models, such as the boundaries
               between di˙erent rock layers. After annotating, geologists
               create logs, a graphic description of the rock layers. To
               establish a geological model of a larger region,
               corresponding layers are correlated in multiple logs. The
               correlated layers of the logs are graphically linked in a
               correlation panel. Creating correlation panels is very
               time-consuming, and they are usually created by hand with
               drawing programs. Due to this restriction, the diagrams are
               created at the end of the interpretation process to avoid
               time-consuming editing afterwards. When switching to a
               drawing program, the connection between the original data
               and the encoded data in the diagram is also lost. This work
               is part of a design study with the aim of automating the
               creation of correlation panels, and turning a static
               illustration into an interactive application that can be
               integrated into the interpretation process. In this work,
               after a short introduction to the exploration of Mars with
               the help of geology, we analyse published correlation panels
               to explore the design space of these illustrations. In
               addition to that analysis we conducted workshops and a
               research stay at Imperial College London with our domain
               collaborators. Using the information gained from the
               analysis and our collaborators, we describe possible design
               choices, and extract the minimum requirements for a
               prototype. The prototype created in the course of this work
               was later extended and presented in a paper that encompasses
               the whole design study.",
  month =      aug,
  pages =      "133",
  address =    "Favoritenstrasse 9-11/E193-02, A-1040 Vienna, Austria",
  school =     "Research Unit of Computer Graphics, Institute of Visual
               Computing and Human-Centered Technology, Faculty of
               Informatics, TU Wien",
  keywords =   "visual analytics, 2D-3D integration",
  URL =        "https://www.cg.tuwien.ac.at/research/publications/2021/Nowak_2021/",
}

 image
image Master Thesis
 Poster


