

 Master Thesis
 Poster
Information
- Publication Type: Master Thesis
- Workgroup(s)/Project(s):
- Date: June 2021
- Date (Start): 1. July 2020
- Date (End): 4. June 2021
- TU Wien Library:
- Diploma Examination: 4. June 2021
- Open Access: yes
- First Supervisor: Eduard Gröller

- Pages: 98
- Keywords: Comparative Visualization, Computational Neuroscience
Abstract
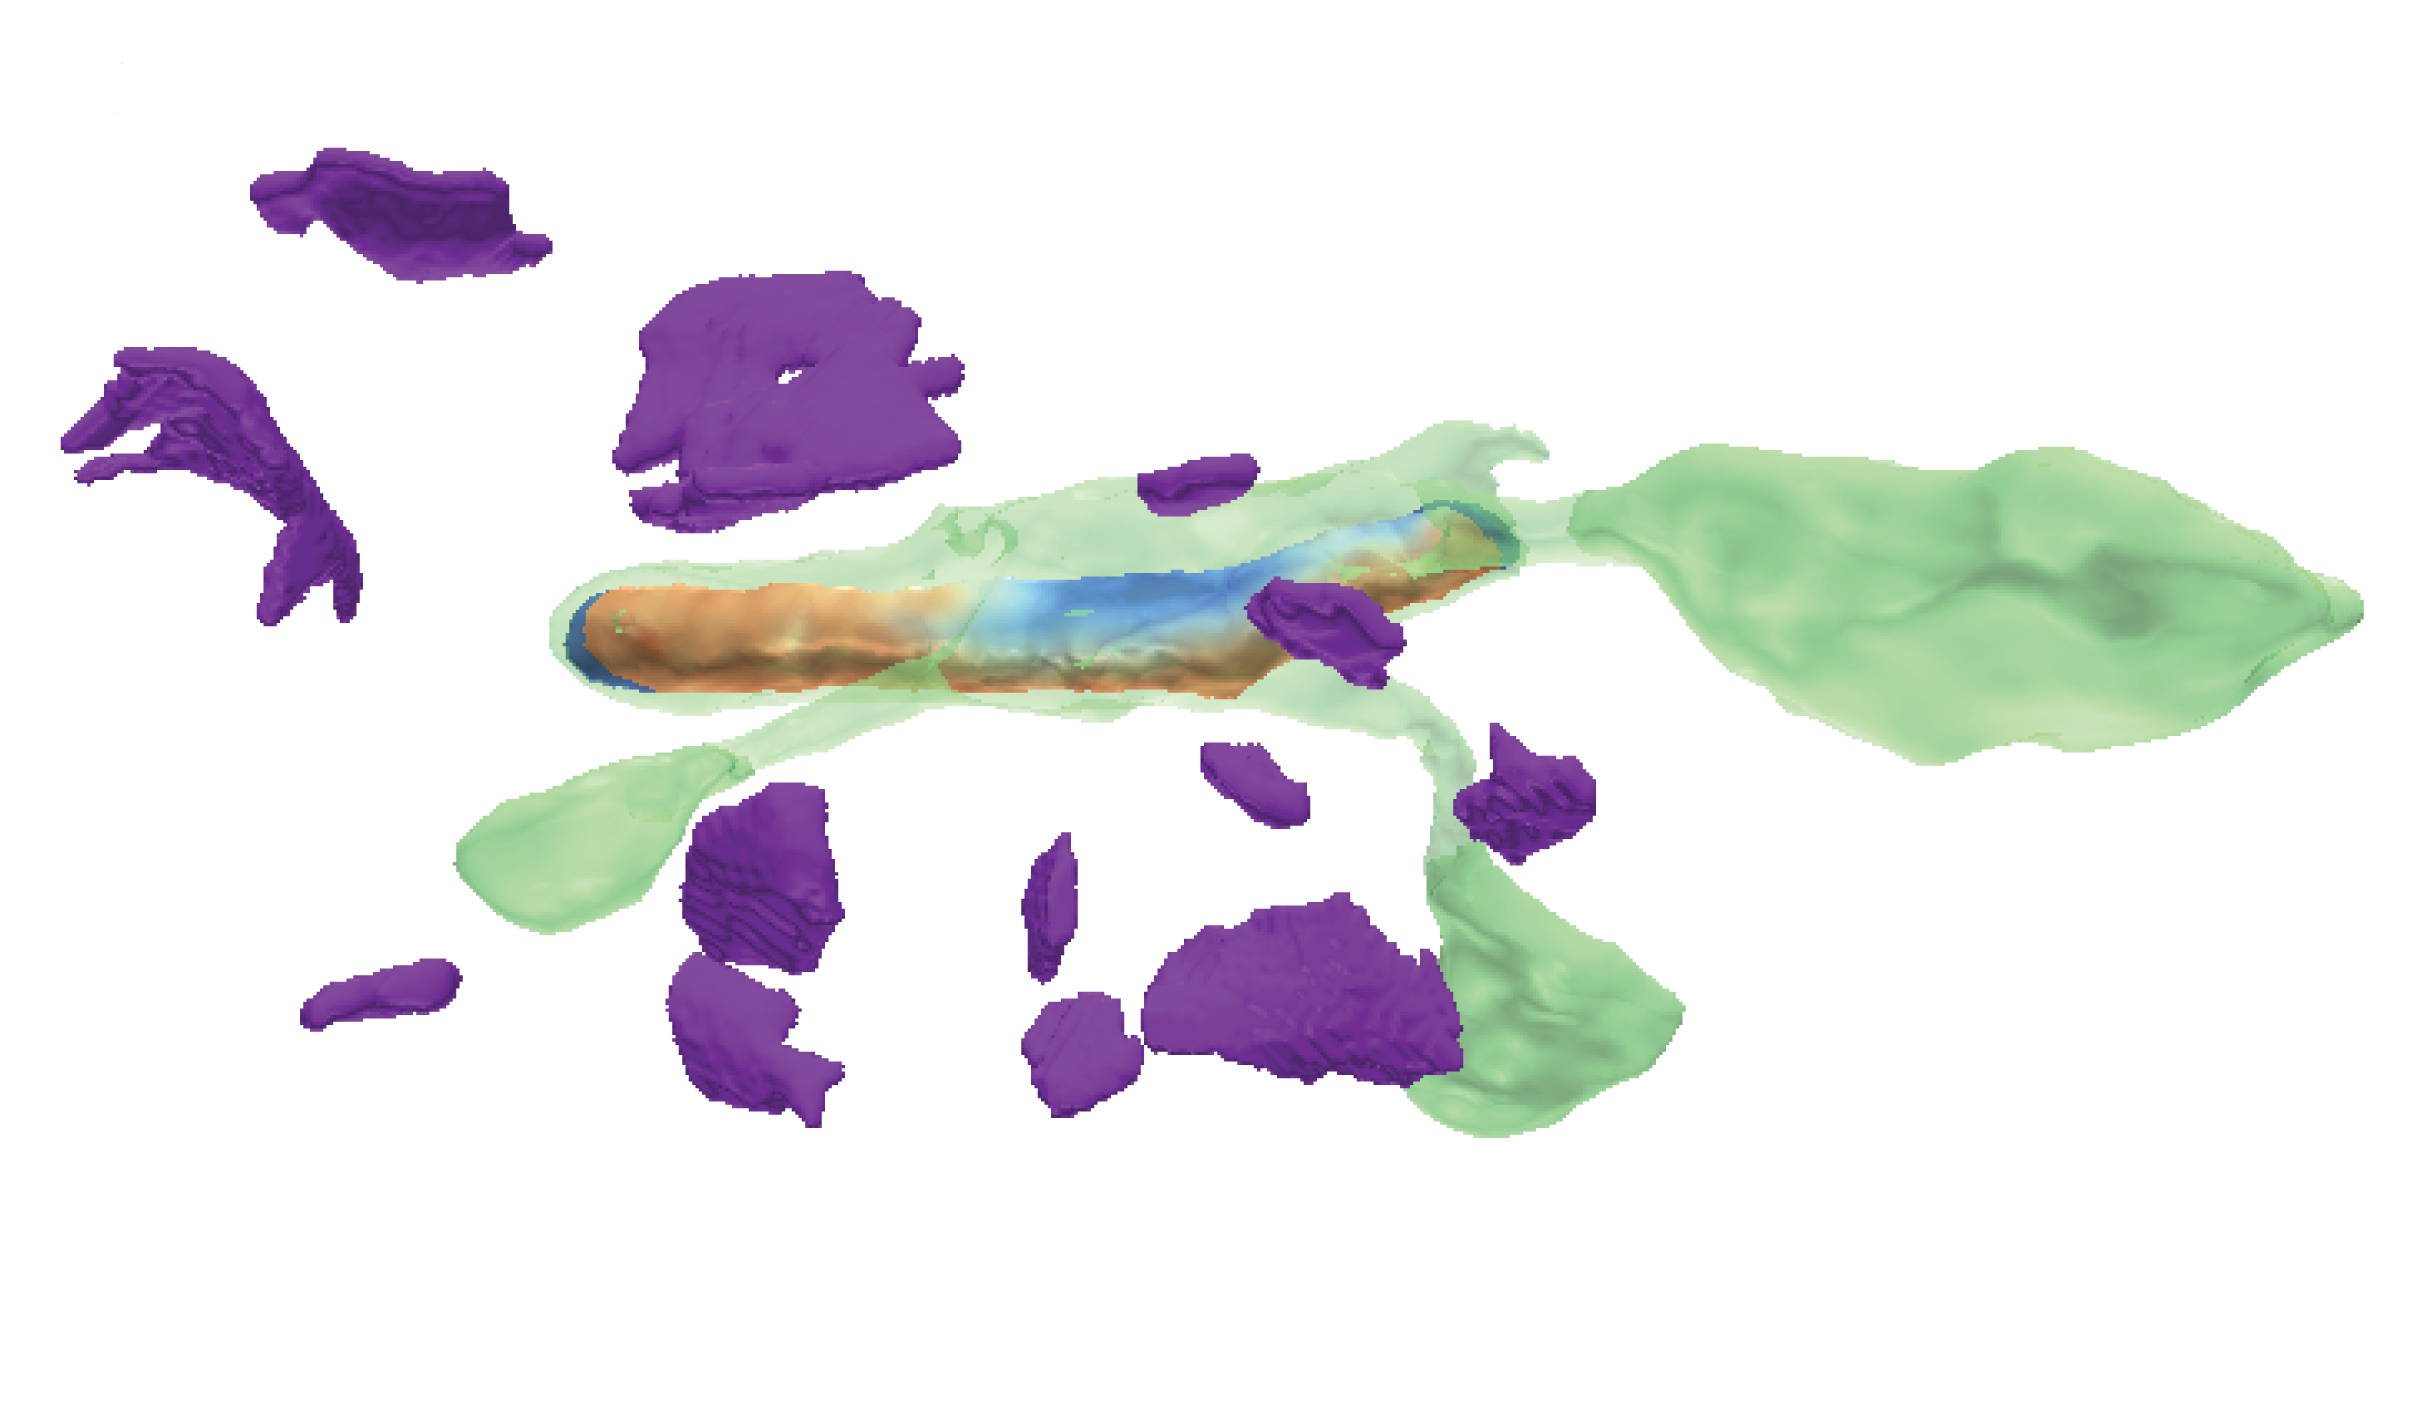
Recent high-resolution electron microscopy imaging allows neuroscientists to reconstruct not just entire cells but individual cell substructures (i.e., cell organelles) as well. Based on these data, scientists hope to get a better understanding of brain function and development through detailed analysis of local organelle neighborhoods. However, in-depth analyses require efficient and scalable comparison of a varying number of cell organelles, ranging from two to hundreds of local spatial neighborhoods. Scientists need to be able to analyze the 3D morphologies of organelles, their spatial distributions and distances, and their spatial correlations. This thesis’s central premise is that it is hard to provide a one-size-fits-all comparative visualization solution to support the given broad range of tasks and scales. To address this challenge, we have designed NeuroKit as an easily configurable toolkit that allows scientists to customize the tool’s workflow, visualizations, and supported user interactions to their specific tasks and domain questions. Furthermore, NeuroKit provides a scalable comparative visualization approach for spatial neighborhood analysis of nanoscale brain structures. NeuroKit supports small multiples of spatial 3D renderings as well as abstract quantitative visualizations, and arranges them in linked and juxtaposed views. To adapt to new domain-specific analysis scenarios, we allow the definition of individualized visualizations and their parameters for each analysis session. This configurability is tied in with a novel scalable visual comparison approach that automatically adjusts visualizations based on the number of structures that are being compared. We demonstrate an in-depth use case for mitochondria analysis in neuronal tissue and analyze the usefulness of NeuroKit in a qualitative user study with neuroscientists.Additional Files and Images


Weblinks
BibTeX
@mastersthesis{Troidl_2021,
  title =      "Spatial Neighborhood Analysis and Comparison for Nanoscale
               Brain Structures",
  author =     "Jakob Troidl",
  year =       "2021",
  abstract =   "Recent high-resolution electron microscopy imaging allows
               neuroscientists to reconstruct not just entire cells but
               individual cell substructures (i.e., cell organelles) as
               well. Based on these data, scientists hope to get a better
               understanding of brain function and development through
               detailed analysis of local organelle neighborhoods. However,
               in-depth analyses require efficient and scalable comparison
               of a varying number of cell organelles, ranging from two to
               hundreds of local spatial neighborhoods. Scientists need to
               be able to analyze the 3D morphologies of organelles, their
               spatial distributions and distances, and their spatial
               correlations. This thesis’s central premise is that it is
               hard to provide a one-size-fits-all comparative
               visualization solution to support the given broad range of
               tasks and scales. To address this challenge, we have
               designed NeuroKit as an easily configurable toolkit that
               allows scientists to customize the tool’s workflow,
               visualizations, and supported user interactions to their
               specific tasks and domain questions. Furthermore, NeuroKit
               provides a scalable comparative visualization approach for
               spatial neighborhood analysis of nanoscale brain structures.
               NeuroKit supports small multiples of spatial 3D renderings
               as well as abstract quantitative visualizations, and
               arranges them in linked and juxtaposed views. To adapt to
               new domain-specific analysis scenarios, we allow the
               definition of individualized visualizations and their
               parameters for each analysis session. This configurability
               is tied in with a novel scalable visual comparison approach
               that automatically adjusts visualizations based on the
               number of structures that are being compared. We demonstrate
               an in-depth use case for mitochondria analysis in neuronal
               tissue and analyze the usefulness of NeuroKit in a
               qualitative user study with neuroscientists.",
  month =      jun,
  pages =      "98",
  address =    "Favoritenstrasse 9-11/E193-02, A-1040 Vienna, Austria",
  school =     "Research Unit of Computer Graphics, Institute of Visual
               Computing and Human-Centered Technology, Faculty of
               Informatics, TU Wien",
  keywords =   "Comparative Visualization, Computational Neuroscience",
  URL =        "https://www.cg.tuwien.ac.at/research/publications/2021/Troidl_2021/",
}