Information
- Publication Type: Master Thesis
- Workgroup(s)/Project(s): not specified
- Date: June 2021
- Date (Start): January 2021
- Date (End): June 2021
- TU Wien Library:
- Diploma Examination: 21. June 2021
- Open Access: yes
- Keywords: multivariate time-series, visual analytics, automated factories
Abstract
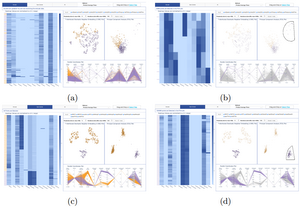
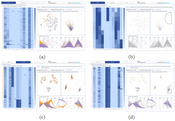
Developments in the field of data analytics provides a boost for small-sized factories. These factories are eager to take full advantage of the potential insights in the remotely collected data to minimise cost and maximise quality and profit. This project aims to process, cluster and visualise sensory data of a blow moulding machine in a plastic production factory. In collaboration with Lean Automation, we aim to develop a data visualisation solution to enable decision-makers in a plastic factory to improve their production process. We will investigate three different aspects of the solution: methods for processing multivariate time-series data, clustering approaches for the sensory-data cultivated, and visualisation techniques that maximises production process insights. We use a formative evaluation method to develop a solution that meets partners' requirements and best practices within the field. Through building the MTSI dashboard tool, we hope to answer questions on optimal techniques to represent, cluster and visualise multivariate time series data.Additional Files and Images
Weblinks
BibTeX
@mastersthesis{musleh_maath-2021-mam2,
  title =      "Visual Analysis of Industrial Multivariate Time-Series Data:
               Effective Solution to Maximise Insights from Blow Moulding
               Machine Sensory Data",
  author =     "Maath Musleh",
  year =       "2021",
  abstract =   "Developments in the field of data analytics provides a boost
               for small-sized factories. These factories are eager to take
               full advantage of the potential insights in the remotely
               collected data to minimise cost and maximise quality and
               profit. This project aims to process, cluster and visualise
               sensory data of a blow moulding machine in a plastic
               production factory. In collaboration with Lean Automation,
               we aim to develop a data visualisation solution to enable
               decision-makers in a plastic factory to improve their
               production process. We will investigate three different
               aspects of the solution: methods for processing multivariate
               time-series data, clustering approaches for the sensory-data
               cultivated, and visualisation techniques that maximises
               production process insights. We use a formative evaluation
               method to develop a solution that meets partners'
               requirements and best practices within the field. Through
               building the MTSI dashboard tool, we hope to answer
               questions on optimal techniques to represent, cluster and
               visualise multivariate time series data. ",
  month =      jun,
  address =    "Favoritenstrasse 9-11/E193-02, A-1040 Vienna, Austria",
  school =     "Research Unit of Computer Graphics, Institute of Visual
               Computing and Human-Centered Technology, Faculty of
               Informatics, TU Wien",
  keywords =   "multivariate time-series, visual analytics, automated
               factories",
  URL =        "https://www.cg.tuwien.ac.at/research/publications/2021/musleh_maath-2021-mam2/",
}


