

Vaishali Dhanoa
From Analysis to Communication: Supporting Users in Understanding Complex Spreadsheets and Dashboards
Supervisor: Marc Streit
Duration: 11. October 2020 — 26. September 2024
[image] [ PhD Thesis]
Information
- Publication Type: PhD-Thesis
- Workgroup(s)/Project(s):
- Date: September 2024
- Date (Start): 11. October 2020
- Date (End): 26. September 2024
- TU Wien Library:
- Second Supervisor: W Aigner
- Open Access: yes
- 1st Reviewer: Eduard Gröller
- Rigorosum: 1. October 2024
- First Supervisor: Marc Streit
Abstract
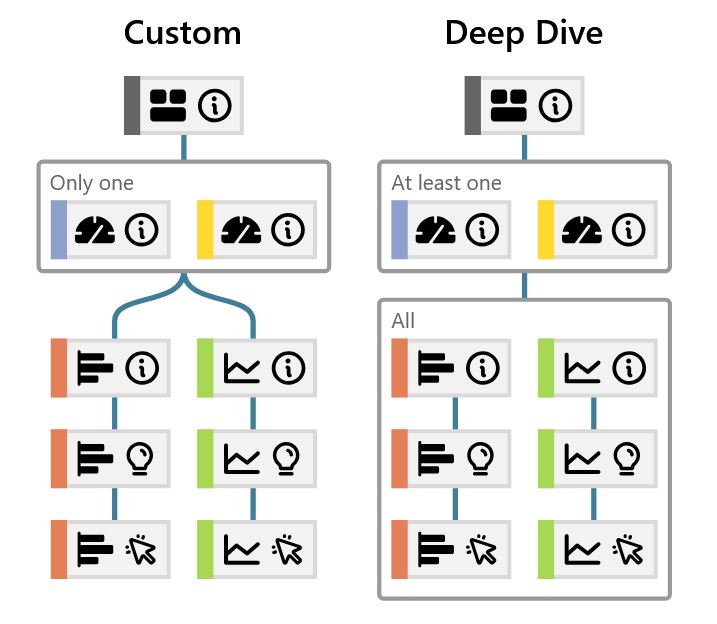
Advancements in big data processing and interactive visualization tools have led to significant changes in how users analyze and explore their data. This thesis aims to address the challenges resulting from these changes through a two-step approach to support users. We first address the issues at the spreadsheet level before moving on to more complex visual representations in a dashboard environment. We use the Fuzzy Spreadsheet approach at the spreadsheet level to include uncertain information in the decision-making process. Our approach augments traditional spreadsheets with uncertain information where a cell can hold and display a distribution of values, in addition to other contextually relevant information, such as impact and relationship between cells, to convey sensitivity and robustness information to the user. When users transition from spreadsheet representations to advanced visualization tools such as interactive dashboards, they often face challenges related to their use that can lead them to revert to their old, familiar static analysis tools. With the help of dashboard onboarding, authors can communicate the intended use and purpose of their dashboards, along with the workings of visualizations present on the dashboards, to fill the user’s knowledge gap. We created a process model for dashboard onboarding that formalizes and unifies different onboarding strategies for dashboards and facilitates the design and implementation of new onboarding approaches. Using this process model as a base and drawing inspiration from the fields of data storytelling and open-world game design, we developed an approach for crafting semi-automated interactive dashboard tours (D-Tours) to produce an onboarding experience tailored to individual users while preserving their agency. We implemented this concept in a tool called D-Tour Prototype which allows authors to create D-Tours from scratch or using automatic templates. Finally, we provide future directions based on the insights from this thesis to explore the role of AI in the design and development of dashboard onboarding.Additional Files and Images

Weblinks
No further information available.BibTeX
@phdthesis{Dhanoa2024,
  title =      "From Analysis to Communication: Supporting Users in
               Understanding Complex Spreadsheets and Dashboards",
  author =     "Vaishali Dhanoa",
  year =       "2024",
  abstract =   "Advancements in big data processing and interactive
               visualization tools have led to significant changes in how
               users analyze and explore their data. This thesis aims to
               address the challenges resulting from these changes through
               a two-step approach to support users. We first address the
               issues at the spreadsheet level before moving on to more
               complex visual representations in a dashboard environment.
               We use the Fuzzy Spreadsheet approach at the spreadsheet
               level to include uncertain information in the
               decision-making process. Our approach augments traditional
               spreadsheets with uncertain information where a cell can
               hold and display a distribution of values, in addition to
               other contextually relevant information, such as impact and
               relationship between cells, to convey sensitivity and
               robustness information to the user. When users transition
               from spreadsheet representations to advanced visualization
               tools such as interactive dashboards, they often face
               challenges related to their use that can lead them to revert
               to their old, familiar static analysis tools. With the help
               of dashboard onboarding, authors can communicate the
               intended use and purpose of their dashboards, along with the
               workings of visualizations present on the dashboards, to
               fill the user’s knowledge gap. We created a process model
               for dashboard onboarding that formalizes and unifies
               different onboarding strategies for dashboards and
               facilitates the design and implementation of new onboarding
               approaches. Using this process model as a base and drawing
               inspiration from the fields of data storytelling and
               open-world game design, we developed an approach for
               crafting semi-automated interactive dashboard tours
               (D-Tours) to produce an onboarding experience tailored to
               individual users while preserving their agency. We
               implemented this concept in a tool called D-Tour Prototype
               which allows authors to create D-Tours from scratch or using
               automatic templates. Finally, we provide future directions
               based on the insights from this thesis to explore the role
               of AI in the design and development of dashboard onboarding.",
  month =      sep,
  address =    "Favoritenstrasse 9-11/E193-02, A-1040 Vienna, Austria",
  school =     "Research Unit of Computer Graphics, Institute of Visual
               Computing and Human-Centered Technology, Faculty of
               Informatics, TU Wien ",
  URL =        "https://www.cg.tuwien.ac.at/research/publications/2024/Dhanoa2024/",
}