| Image |
Bib Reference |
Publication Type |
| 2019 |
 |
Guangping Li, Soeren Nickel, Martin Nöllenburg, Ivan Viola , Hsiang-Yun Wu , Hsiang-Yun Wu
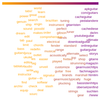
World map of recipes
[ poster] poster] |
Unknown Publication |
 |
Hsiang-Yun Wu , Martin Nöllenburg, Ivan Viola , Martin Nöllenburg, Ivan Viola
Map of Metabolic Harmony
[ image-full] image-full] |
Unknown Publication |
|
Nicolas Grossmann, Oscar Casares-Magaz, Ludvig Paul Muren, Vitali Moiseenko, John P. Einck, Eduard Gröller , Renata Raidou , Renata Raidou
Pelvis Runner: Visualizing Pelvic Organ Variability in a Cohort of Radiotherapy Patients
In Eurographics Workshop on Visual Computing for Biology and Medicine (2019), pages 69-78. September 2019.
|
Conference Paper |
|
Georg Bernold, Kresimir Matkovic , Eduard Gröller , Eduard Gröller , Renata Raidou , Renata Raidou
preha: Establishing Precision Rehabilitation with Visual Analytics
In Eurographics Workshop on Visual Computing for Biology and Medicine (2019), pages 79-89. September 2019.
|
Conference Paper |
 |
Stefan Sietzen
Web-Interface for neural network feature visualization
[VISxAI URL] |
Student Project |
|
Renata Raidou
Visual Analytics for the Representation, Exploration and Analysis of High-Dimensional, Multi-Faceted Medical Data
In Biomedical Visualisation, pages 137-162, July 2019
|
Article in a Book |
 |
Kazuyo Mizuno, Hsiang-Yun Wu , Shigeo Takahashi, Takeo Igarashi , Shigeo Takahashi, Takeo Igarashi
Optimizing Stepwise Animation in Dynamic Set Diagrams
Computer Graphics Forum, 38:13-24, July 2019. [ paper] [video] paper] [video] |
Journal Paper with Conference Talk |
 |
Ken Maruyama, Shigeo Takahashi, Hsiang-Yun Wu , Kazuo Misue, Masatoshi Arikawa , Kazuo Misue, Masatoshi Arikawa
Scale-Aware Cartographic Displacement Based on Constrained Optimization
In Proceedings of the 23th International Conference on Information Visualisation (iV2019), pages 74-80. July 2019.
|
Conference Paper |
 |
Jan Byska, Thomas Trautner, Sergio Marques, Jiri Damborsky, Barbora Kozlikova, Manuela Waldner
Analysis of Long Molecular Dynamics Simulations Using Interactive Focus+Context Visualization
Computer Graphics Forum, 38(3):441-453, June 2019. [ paper] [ paper] [ video] video] |
Journal Paper with Conference Talk |
 |
Shigeo Takahashi, Ken Maruyama, Takamasa Kawagoe, Hsiang-Yun Wu , Kazuo Misue, Masatoshi Arikawa , Kazuo Misue, Masatoshi Arikawa
Mental Map Preservation for Progressively Labeling Railway Networks
International Journal of Art, Culture and Design Technologies, 8(1):31-50, June 2019. [ pdf] pdf] |
Journal Paper (without talk) |
 |
Jakob Troidl
Flow Visualization on Curved Manifolds
[ Bachelor Thesis] [ Bachelor Thesis] [ image] [Youtube: Flow Visualization on Curved Manifolds] image] [Youtube: Flow Visualization on Curved Manifolds] |
Bachelor Thesis |
 |
Hsiang-Yun Wu , Martin Nöllenburg, Filipa L. Sousa, Ivan Viola , Martin Nöllenburg, Filipa L. Sousa, Ivan Viola
Metabopolis: Scalable Network Layout for Biological Pathway Diagrams in Urban Map Style
BMC Bioinformatics, 20(187):1-20, May 2019. [ paper] [video] paper] [video] |
Journal Paper (without talk) |
 |
Gwendolyn Rippberger
Data-Driven Anatomical Layouting of Brain Network Graphs
[ Bachelor Thesis] [ Bachelor Thesis] [ image] image] |
Bachelor Thesis |
 |
Elitza Vasileva, Hsiang-Yun Wu
OptiRoute: Interactive Maps for Wayfinding in a Complex Environment
Poster shown at schematic Mapping Workshop 2019
(2019)
|
Poster |
 |
Hsiang-Yun Wu , Benjamin Niedermann, Shigeo Takahashi, Martin Nöllenburg , Benjamin Niedermann, Shigeo Takahashi, Martin Nöllenburg
A Survey on Computing Schematic Network Maps: The Challenge to Interactivity,
11. April 2019, The 2nd Schematic Mapping Workshop 2019, Vienna, Austria
[ paper] paper] |
WorkshopTalk |
 |
Hsiang-Yun Wu , Ken Maruyama, Takamasa Kawagoe, Kazuo Misue, Masatoshi Arikawa, Shigeo Takahashi , Ken Maruyama, Takamasa Kawagoe, Kazuo Misue, Masatoshi Arikawa, Shigeo Takahashi
Aspect-Ratio-Preserved Labeling on Metro Maps
Poster shown at Schematic Mapping Workshop 2019
(2019)
|
Poster |
 |
Muhammad Samoul
Visual Comparison of NLP Pipelines
|
Student Project |
|
Hsiang-Yun Wu , Haichao Miao, Ivan Viola , Haichao Miao, Ivan Viola
From Cells to Atoms - Biological Information Visualization (in Chinese)
TR-193-02-2019-1, March 2019 [ paper] paper] |
Technical Report |
|
Renata Raidou , Eduard Gröller , Eduard Gröller , Martin Eisemann , Martin Eisemann
Relaxing Dense Scatter Plots with Pixel-Based Mappings
IEEE Transactions on Visualization and Computer Graphics, 25:1-12, March 2019. |
Journal Paper with Conference Talk |
 |
Nicholas Waldin, Manuela Waldner , Mathieu Le Muzic, Eduard Gröller , Mathieu Le Muzic, Eduard Gröller , David Goodsell, Ludovic Autin, Arthur Olson, Ivan Viola , David Goodsell, Ludovic Autin, Arthur Olson, Ivan Viola
Cuttlefish: Color Mapping for Dynamic Multi‐Scale Visualizations
Computer Graphics Forum, 38(6):150-164, March 2019. [Open Access Article in Wiley Online Library] |
Journal Paper (without talk) |
 |
Harald Steinlechner, Georg Haaser, Bernd Oberdorfer, Daniel Habe, Stefan Maierhofer, Michael Schwärzler, Eduard Gröller
A Novel Approach for Immediate, Interactive CT Data Visualization andEvaluation using GPU-based Segmentation and Visual Analysis
In International Conference on Industrial Computed Tomography (ICT) 2019, pages 1-6. February 2019.
[ draft] draft] |
Conference Paper |
 |
Katharina Unger
Visual Comparison of Organism-Specific Metabolic Pathways
[ CESCG paper] CESCG paper] |
Student Project |
 |
Vahan Yoghourdjian, Daniel Archambault, Stephan Diehl, Tim Dwyer, Karsten Klein, Helen C. Purchase, Hsiang-Yun Wu
Exploring the limits of complexity: A survey of empirical studies ongraph visualisation
Visual Informatics, 2(4):264-282, January 2019. [ paper] paper] |
Journal Paper (without talk) |
 |
Patrick Hromniak
Visual Comparison of Natural Language Processing Pipelines
|
Bachelor Thesis |
| 2018 |
|
Daniel Archambault, Jessie Kennedy, Tatiana von Landesberger, Mark McCann, Fintan McGee, Benjamin Renoust, Hsiang-Yun Wu
Lost in Translation: Alignment of Mental Representations for Visual Analytics, Reimagining the Mental Map and Drawing Stability (NII Shonan Meeting Seminar 127)
TR-193-02-2018-1, December 2018 [ paper] paper] |
Technical Report |
 |
Elitza Vasileva
Interactive Maps for Visualizing Optimal Route Planning Strategy
[ image] image] |
Bachelor Thesis |
 |
Maximilian Deutsch
Generating seating plan images using clustering and concave hull algorithms
|
Bachelor Thesis |
 |
Georg Edlinger
Visually Linking web search results with bookmarked information
|
Bachelor Thesis |
 |
Daniel Steinböck, Eduard Gröller , Manuela Waldner , Manuela Waldner
Casual Visual Exploration of Large Bipartite Graphs Using Hierarchical Aggregation and Filtering
In International Symposium on Big Data Visual and Immersive Analytics. October 2018.
[ paper] paper] |
Conference Paper |
|
Manfred Klaffenböck
(untitled)
Supervisor: Michael Wimmer
Duration: September 2018 —
|
Ongoing PhD-Thesis |
 |
Thomas Mühlbacher
Human-Oriented Statistical Modeling: Making Algorithms Accessible through Interactive Visualization
Supervisor: Eduard Gröller
Duration: June 2012 — August 2018
[ image] image] |
PhD-Thesis |
 |
Klaus Eckelt
Data-Driven User Guidance in Multi-Attribute Data Exploration
[ image] [ image] [ Poster] Poster] |
Master Thesis |
 |
Yuka Yoshida, Ken Maruyama, Takamasa Kawagoe, Hsiang-Yun Wu , Masatoshi Arikawa, Shigeo Takahashi , Masatoshi Arikawa, Shigeo Takahashi
Progressive Annotation of Schematic Railway Maps
In Proceedings of the 22nd International Conference Information Visualisation (IV). July 2018.
|
Conference Paper |
 |
Michael Mazurek, Manuela Waldner
Visualizing Expanded Query Results
Computer Graphics Forum:87-98, June 2018. [ paper] [ paper] [ video] video] |
Journal Paper with Conference Talk |
 |
Haichao Miao, Elisa De Llano, Tobias Isenberg, Eduard Gröller , Ivan Barisic, Ivan Viola , Ivan Barisic, Ivan Viola
DimSUM: Dimension and Scale Unifying Maps for Visual Abstraction of DNA Origami Structures
Computer Graphics Forum, 37(3), June 2018. [ Paper] Paper] |
Journal Paper with Conference Talk |
 |
Hsiang-Yun Wu , Martin Nöllenburg, Ivan Viola , Martin Nöllenburg, Ivan Viola
A Visual Comparison of Hand-Drawn and Machine-Generated Human Metabolic Pathways
Poster shown at EuroVis
( 4. June 2018- 8. June 2018)
[ poster] poster] |
Poster |
 |
Daniel Steinböck
Interactive Visual Exploration Interface for Large Bipartite Networks
[ Master Thesis] [ Master Thesis] [ Poster] [ Poster] [ sketch] sketch] |
Master Thesis |
 |
Matthias Gusenbauer
Bitstream - A bottom-up/top-down hybrid approach for web-based visual analysis of big data
[ image] [ image] [ Master thesis] Master thesis] |
Master Thesis |
 |
Matthias Gusenbauer
Bitstream - Top-Down/Bottom-Up Data Processing for Interactive Bitcoin Visualization.
Poster shown at EPILOG
(18. June 2018)
[ image] image] |
Poster |
 |
Michael Birsak, Przemyslaw Musialski , Peter Wonka , Peter Wonka , Michael Wimmer , Michael Wimmer
Dynamic Path Exploration on Mobile Devices
IEEE Transactions on Visualization and Computer Graphics, 24(5):1784-1798, May 2018. [ preprint] preprint] |
Journal Paper (without talk) |
 |
Yan Cai
Research on Graphical Interfaces to Perform Anatomical Queries on Large Collections of Gene Expression Images
[ Bachelor Thesis] [ Bachelor Thesis] [ image] image] |
Bachelor Thesis |
 |
Dea Cizmic
Exploratory Data Visualization Dashboard for Technical Analysis of Commodity Market Indicators
|
Bachelor Thesis |
 |
Martin Smiech
Configurable Text Exploration Interface with NLP for Decision Support
|
Bachelor Thesis |
 |
Hsiang-Yun Wu , Martin Nöllenburg, Ivan Viola , Martin Nöllenburg, Ivan Viola
The Travel of a Metabolite
submitted to PacificVis 2018 Data Story Telling Contest
[ paper] [ paper] [ video] video] |
Miscellaneous Publication |
 |
Patrik Polatsek, Manuela Waldner , Ivan Viola , Ivan Viola , Peter Kapec, Wanda Benesova , Peter Kapec, Wanda Benesova
Exploring visual attention and saliency modeling for task-based visual analysis
Computers & Graphics, (2), February 2018. [ paper] paper] |
Journal Paper (without talk) |
 |
Hsiang-Yun Wu , Shigeo Takahashi, Rie Ishida , Shigeo Takahashi, Rie Ishida
Overlap-Free Labeling of Clustered Networks Based on Voronoi Tessellation
Journal of Visual Languages & Computing, (44), February 2018. [ paper] paper] |
Journal Paper (without talk) |
 |
Julian Strohmayer
A Visual Analytics Approach to Hypocotyl/Root Transition Detection in Arabidopsis Thaliana
[ image] image] |
Bachelor Thesis |
 |
Renata Raidou
EuroVis Best PhD Award 2018—Visual Analytics for Digital Radiotherapy: Towards a Comprehensible Pipeline
|
Miscellaneous Publication |
|
Radu Jianu, Martin Krzywinski, Luana Micallef, Hsiang-Yun Wu
Mapifying the Genome, Scalable Set Visualizations (Dagstuhl Seminar 17332)
TR-193-02-2018-2, 2018 [ paper] paper] |
Technical Report |
| 2017 |
|
Werner Purgathofer
From Visualization to Decision Support,
29. September 2017, Hangzhou, China
|
Invited Talk |