
Region and Volume Tools
Analysis is quick and easy using Alice's extensive Region and Volume tool
set. Create Regions of Interest (ROIs) and Volumes of Intererst (VOIs) instantly
with just a few commands. Alice predefines eight VOIs for you in distinctive
colors. All image processing operations can apply to the whole image data
set or only to the regions or volumes you select.
Easily Create Regions and Volumes of Interest
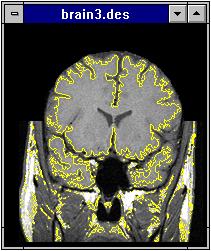
- Instantly define anatomical features using Alice's AutoSegmentation
Tool, which finds the best guess edge of an object and automatically
draws a ROI around it.
- Quickly outline anatomical or irregular ROIs without painstakingly
tracing an exact edge using either Range to ROI or Shrink
Wrap ROI. These commands define ROIs based on image values and
a specified numerial range. The Range command uses in-range pixels to define
the interior. The Shrink Wrap command defines the outer boundary so that
the resulting ROI doesn't have holes.
- After drawing a ROI in one slice, automatically duplicate it throughout
the other slices in the study for quick and easy functional analysis, using
Propagate ROIs.
- Anatomical features often change size or shape in each slice. To change
a ROI to fit a specific feature throughout a study, draw the initial ROI
and let Alice automatically adapt it to the best edge in each subsequent
slice with Adaptive Propagate.
Modify Regions and Volumes
- Nudge the edge of a ROI in or out for a better fit simply by sliding
Alice's Nudge Tool along the edge in the direction you want
it to move.
- Quickly add or remove large regions from a selected ROI with the Freehand
Union Tool or the Freehand Difference Tool..
- Shrink or expand ROIs with Alice's automatic Dilate or
Erode commands.
- Fuse gaps or remove fragments in ROI edges with the Close or
Open commands.
Analyze or Process User-Defined Regions
- Easily compute basic statistics for each slice or volume in a selected
range using the Region Statistics or the Volume Statistics
commands. Alice computes statistics in real world units, reflecting pixel
dimensions.
- Statistical measurements appear in the Results Window,
with each row representing a single slice and each column a different statistic.
Automatically update the Results Window if the ROI moves or the study changes,
by selecting Hot-Link Statistical Measurements.
- Effortlessly compute a statistical measurement for each slice in a
selected range and graph the results as a function of slice distance with
Plot Region Statistics. The computation uses only the region
of the image bounded by applicable ROIs and uses real world units.
- Compute a histogram of a region's image values over a specified range
of pixel values using the Histogram command.
All image processing operations in Alice apply to either the whole
image data set or the regions or volumes you select.
Copyright © 1997-98
by PAREXEL® International Corporation.
All Rights Reserved