Visualizing Measured BSDFs
In this project, we aim to visualize the directional distributions of analytic and data-driven BSDFs. Our tool allows the design of multivariate distributions. To that end, the designer is supported by visual representations of abstract data in various levels of detail. On the highest level, the designer is presented with the original dimensionality of the data giving an overview. For instance, in the case of data-driven BSDFs, the designers are greeted by a 4D representation of the data in multiple 2D slices. Furthermore, our tool allows us to show the data in detail, decomposing the multivariate structure into its marginal and conditional components. Visualization plays a critical role in the design process of a distribution. It not only provides a better understanding of the data but also gives us feedback regarding the fidelity of the designed distribution. Be that in the deepest level representation of the data (e.g., 1D marginal representation) or the highest level (i.e., overview). The design process is moreover supported by a highly interactive user interface, allowing the user to explore the best fit to the reference analytic distribution or the underlying measurements (i.e., data-driven approach).
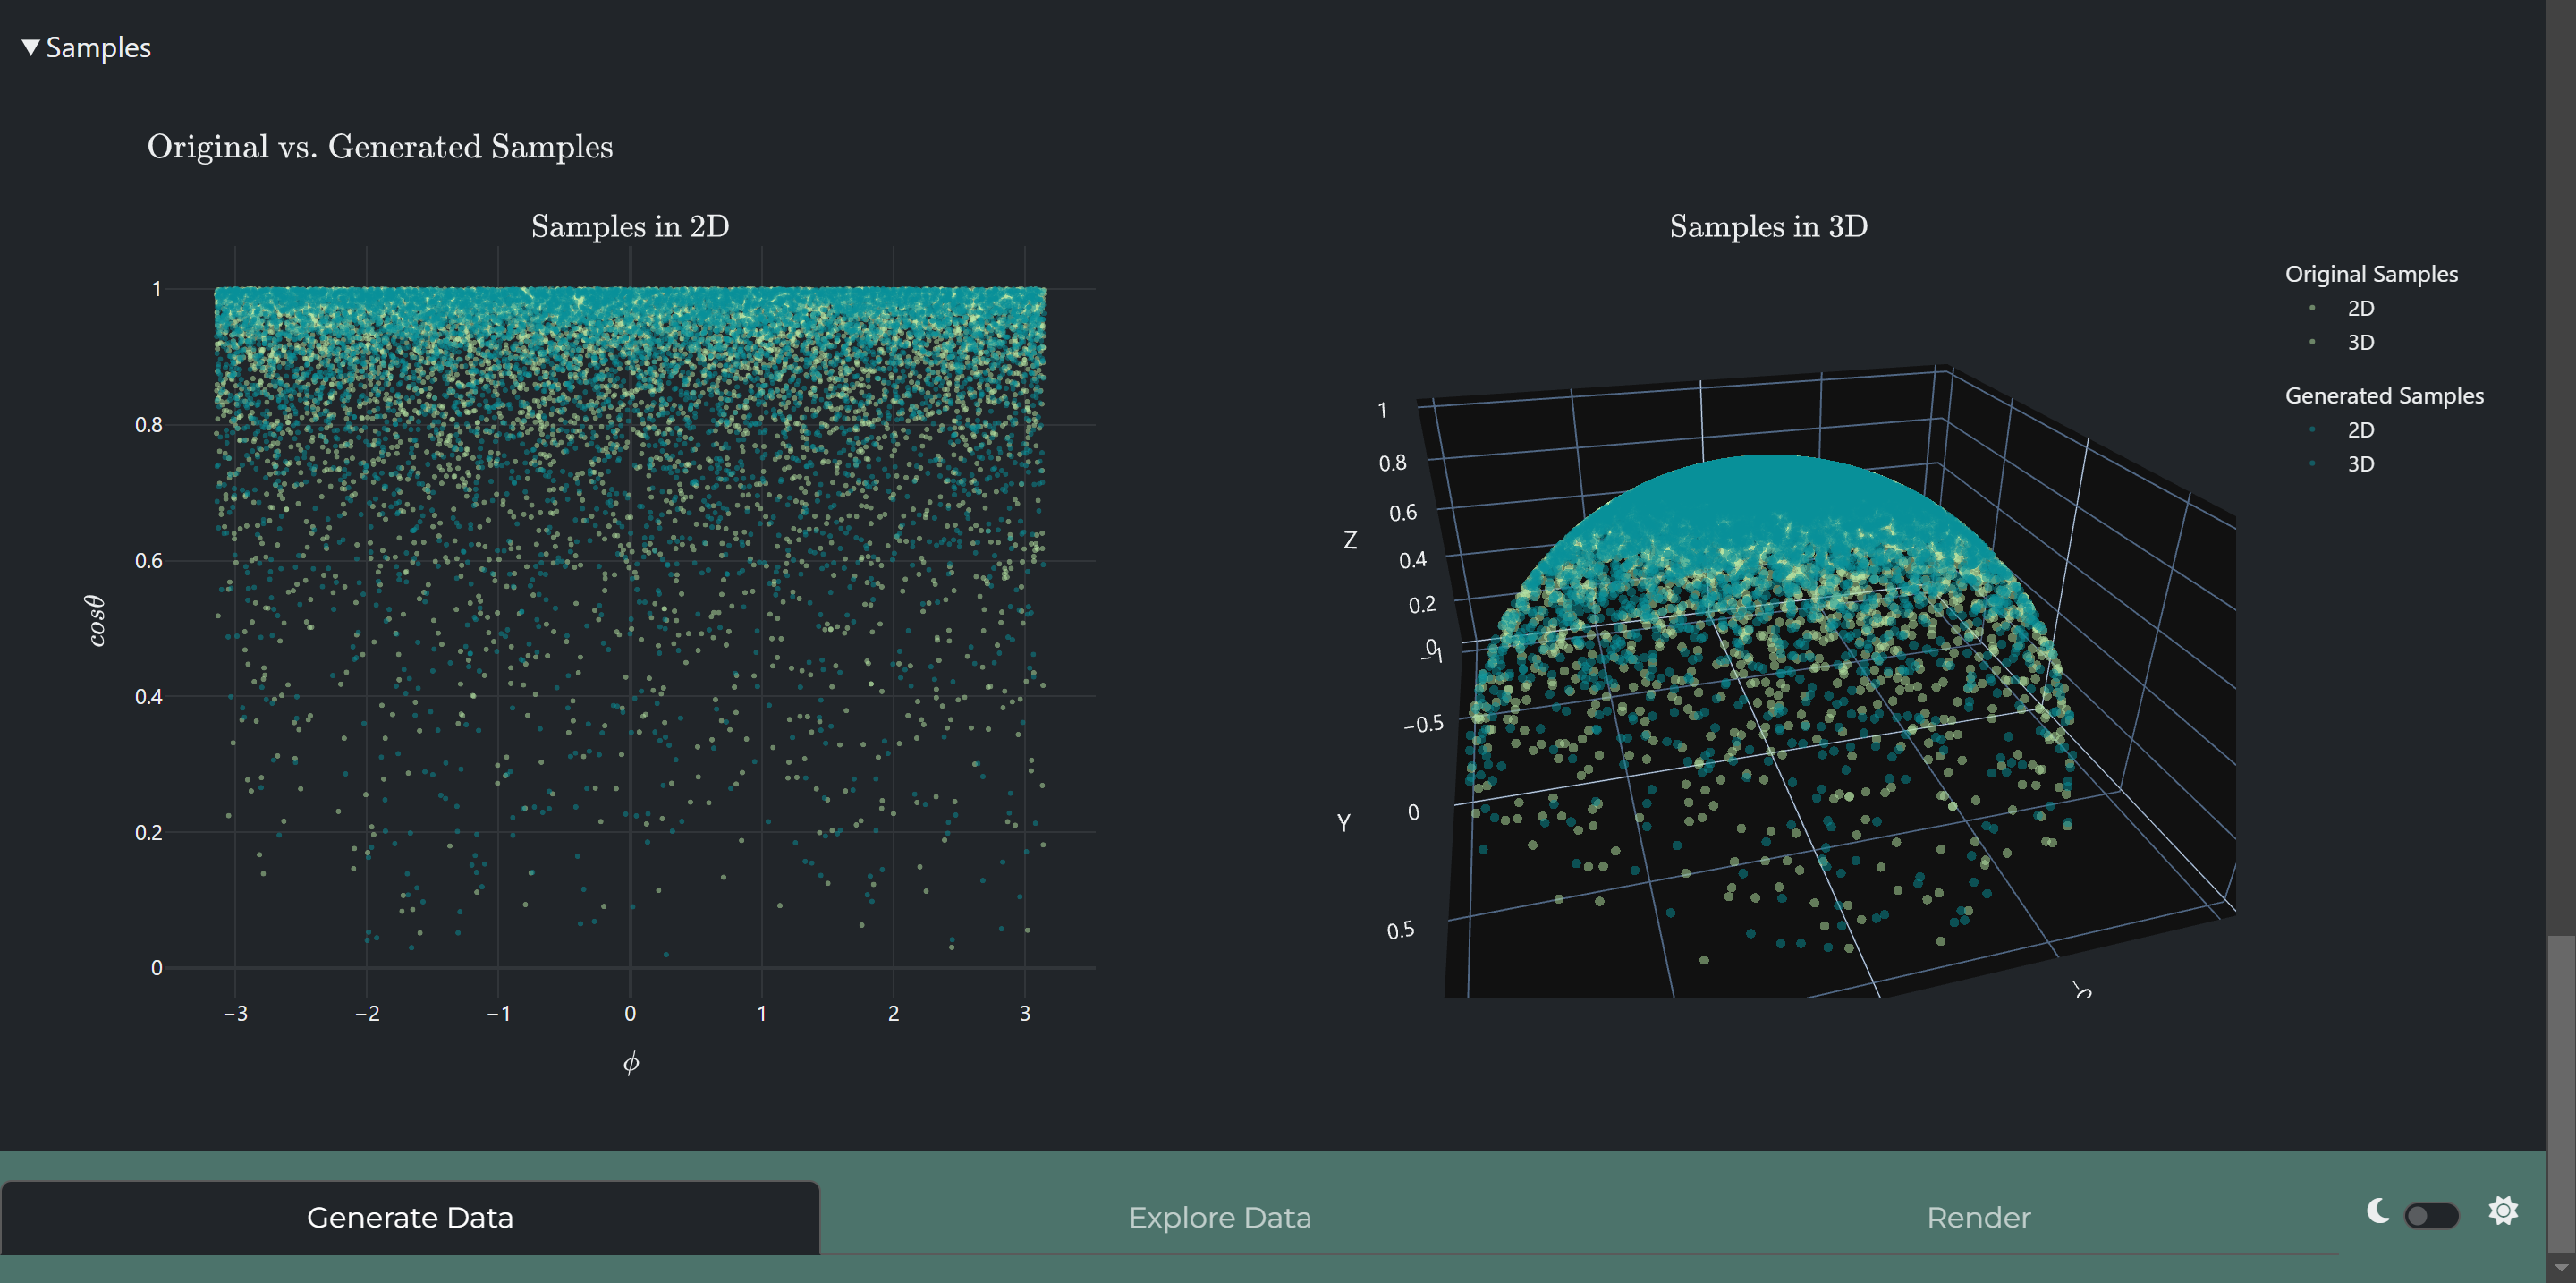
Our tool consists of three parts. The design process takes place in the “generate data” tab. Having a dynamic dataset leads to challenges, one being how to visualize previously designed distributions. The “explore data” tab aims to address this dilemma, allowing designers to show previously saved distributions. Finally, the “render” tab aids the designer to apply newly designed distributions using Mitsuba 3’s [1] custom BSDFs. Consequently, providing the designer with a comparison of the designed BSDF utilizing the designed distribution against the reference BSDF.
- [1] Jakob, W., Speierer, S., Roussel, N., Nimier-David, M., Vicini, D.,
Zeltner, T., Nicolet, B., Crespo, M., Leroy, V., & Zhang, Z. (2022). Mitsuba 3 renderer (Version 3.0.1) [Computer software]. https://mitsuba-renderer.org
Repository for the Visualization 2 project that aims to visualize directional distribution of measured BSDFs.
Important Note
Please do not share this project (code, visuals, etc.) without the permission of the author. This project is part of an ongoing research project (193.023 Project in Visual Computing 1 and 193.024 Project in Visual Computing 2) and a potential leak can greatly hinder the progress.
GitHub
Please note that the current repository is private. For access, please contact
the author at saipcanhasbay@gmail.com.
Clone this repository using:
git clone --recurse-submodules https://github.com/sapo17/GeometryProcessingS2024.git
If you forget to retrieve the submodules, you can use:
git submodule update --init --recursive
Installation
We use Conda. Conda provides package, dependency, and environment management for any language.
We provide an environment file (venv.yml) to create the conda virtual environment. Separate installation of PyTorch is necessary (see also the PyTorch instructions).
1. Create Environment
conda env create -f venv.yml
2. Activate Environment
conda activate vis-bsdfs
3. PyTorch Installation
PyTorch installation may differ depending on your system. Please also refer to the official PyTorch instructions.
Example command:
conda install pytorch torchvision torchaudio pytorch-cuda=12.4 -c pytorch -c nvidia
Run
Visual Studio Code
Go to Run and Debug Tab (
Ctrl + Shift + D).Select Vis-BSDFs on the dropdown menu.
Click the Play Button (
F5).A terminal window will be triggered with a message like
Dash is running on http://127.0.0.1:8050/. Open that link in your preferred web browser.
Terminal
Activate the conda environment (
conda activate vis-bsdfs) in the project root folder (where this file is located).Enter
python app.py.A message such as
Dash is running on http://127.0.0.1:8050/will appear. Open the provided link in your preferred web browser.
Contents
Contents: