Description
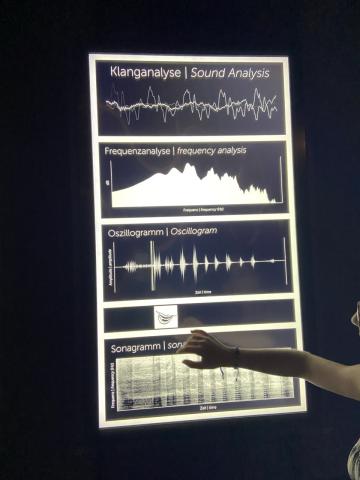
Scatterplots are widely used in data visualization to represent the relationship between two or more variables. However, when dealing with large datasets or highly overlapping points, scatterplots can become cluttered, overdrawn, and difficult to interpret. This project explores a novel approach to addressing this problem by transforming a dense scatterplot into an audio-based representation, ultimately generating a unique audio signature that encapsulates the essential features of the plot.
Tasks
The tasks of this thesis are:
- Scatterplot Sonification: Develop a method to sonify dense scatterplots, transforming visual data points into sound waves that can be analyzed and interpreted.
- Signal Transformation: Convert the sonified scatterplot into a unique audio signature.
- Signature Evaluation: Evaluate the effectiveness of the generated audio signatures in representing the key characteristics of the original scatterplots.
Requirements
- Basic knowledge and understanding of data visualization principles.
- Familiarity with Digital Signal Processing (e.g., Fourier Transform, Time-Frequency Analysis, etc)
- Interest in sound synthesis and psychoacoustics.
- Programming in Python.
References
[1] http://sonification.de/handbook
[2] https://link.springer.com/article/10.1007/s00779-023-01720-5
[3] https://onlinelibrary.wiley.com/doi/full/10.1111/cgf.15114
