User Guide
Background Interface
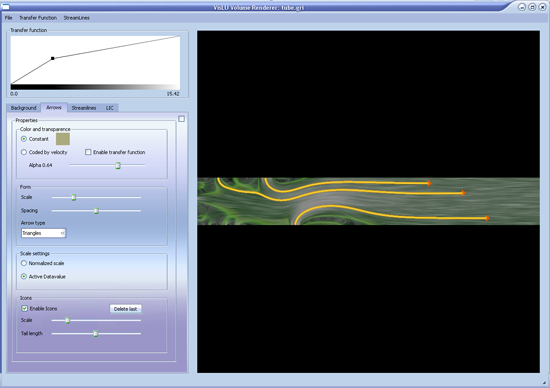
After startup the application provides the user with the background interface and the transferfunction window enabled. The first step will be to load a dataset, which is simply done by clicking on File -> Open or File -> Open Single Dat. The Difference betweend these two is, that the first opens all timesteps, if there are more than one, whereas the second one only opens the selected.
After the Volume is loaded, the user is now able to slice through the timesteps and select the different properties as background. The first properties is always the normalized length of the velocity. A Transferfunction can be chosen for each of these properties.
Transferfunction
In order to provide a better insight into the flowdata, the user is now able to load a transferfunction via the Transfer Function -> Load menu. This dialog supports .btf (binary transfer function) files.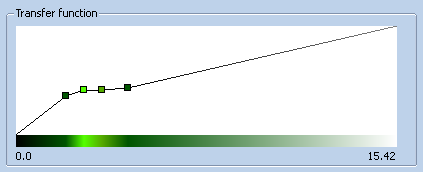
Then the user is able to add points in the transferfunction window by clicking, drag the points by click and drag, remove points by right doubleclick, do a windowed zoom of the histogram by middleclick and drag or zoom the whole window by ALT + doubleclick. When the result is satisfying the transferfunction can be saved in the Transfer Function menu.
The changes of the transferfunction are reflected immediately by the window. The current image of the main window can be saved with File -> Save Image
Arrow Interface
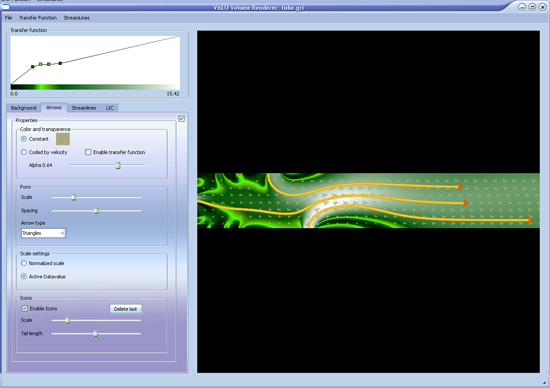
The user is able to change from the background interface into the arrow interface by changing the tab. There the user is able to enable Arrow rendering via the checkbox at the right side of the tab. If enabled it is possible to change size and spacing of the arrows, the glyph form itself. It is also possible to have them color coded by a fixed color and alpha, or by a transferfunction, which encodes velocities. The size can also be changed via the velocities.
Secondly the user is able to enable so called Icons. When the checkbox is enabled, then the user can ALT + Click into the window, and an icon is placed there. Its tail tracks back the flow at the amout of steps controlled by the slider. Of course the general Scale can also be changed.
Streamline Interface
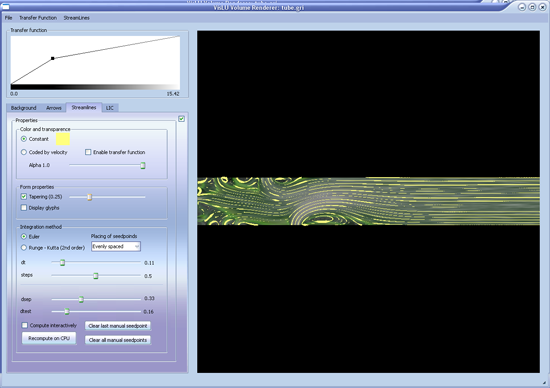
In the Streamline Interface the user is able to enable (via the checkbox on the right) and control the drawing of streamlines. It is possible to select the placement of the streamlines (from different sides, manual, random and evenly spaced). Another option is to choose between euler and runge-kutta integration, if evenly spaced is chosen, only euler is possible. It is possible to change different values for the integration.
Concerning the visual properties, constant coloring or transferfunction based coloring is possible, like with the other features. It is also possible display glyphes instead of the lines, and if evenly spaced streamlines were generated, tapering is also nice option. When glyphes are on, and tapering is off, then the size of the glyphes can be chosen via the tapering slider.
Streamlines can be saved and loaded too.
LIC Interface
In the LIC interface the line integral convolution image can be activated. It is possible to control alpha, or it can be colored via a transferfunction. The gui gives the option to control the number of steps used during integrating and the stepsize. When animate is turned on, these sliders change the amount of animation too. The Animation is done by modulating a gaussian kernel.